


Schumpeter vs. Wall and the Business Cycle Count in the Long Wave
Stock-Markets / Cycles Analysis Jan 30, 2011 - 05:49 AM GMT

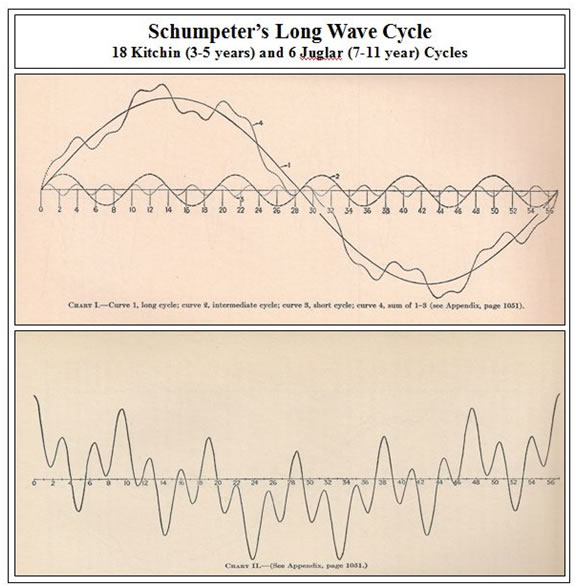
 Joseph Schumpeter was a Harvard economist and president of the Econometric Society (1940-41). He was author of the two-volume tome Business Cycles (McGraw-Hill 1939). Schumpeter’s cycle research is of particular interest because he was one of the first to attempt to integrate sociological understanding into economic trends. He also presented an integrated approach to cycles that presented the Kondratieff long wave as a larger scale of the smaller cycles. In Business Cycles, he introduced a theoretical model for how all the various cycles fit together.
Schumpeter’s model of how all the cycles worked together to produce long waves included Kitchin cycles (the regular business cycle of 3-5 years) and Juglar cycles (7-11 years), with three Kitchins in each Juglar. Schumpeter also wrote of the Kuznets cycles (15-25 years), but didn’t put them in the charts below. The chart depicts the flow of the Kitchin and Juglar cycles integrated in 56-year long wave cycles. Note that Schumpeter’s model presented 18 business cycles in a regular long wave.
Schumpeter was limited by linear mathematics. His ideas needed non-linear dynamical systems to formalize his approach. This is precisely what is proposed at LongWaveDynamics.com, which takes a dynamic systems approach to business cycle analysis, long wave seasons and the Kondratieff long wave cycle, and the smaller cycles used by active traders.
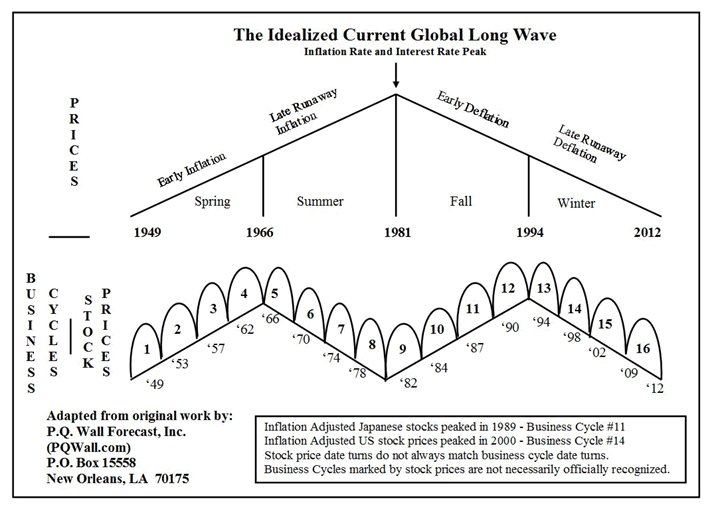
The late market analyst PQ Wall presented a long wave model different from Schumpeter, which was essentially a dynamical systems approach to market cycles. Wall did not describe his approach to stock market and social cycles in terms of dynamic systems, but Wall took what he described as a threeness and fourness approach to cycle divisibility, which was a genuinely novel approach to cycle analysis.
Wall proposed that long waves consist of four seasons of development, much like the natural seasons of the year; spring, summer, fall and winter. This seasonal approach to the long wave cycle is expected to have originated with Oswald Spengler, the German sociologist. Wall divided each season by four, producing sixteen business cycles in every long wave. The chart below presents Wall’s approach to business cycles in a long wave. The important take away is that PQ Wall’s approach produces 16 and not 18 business cycles in every long wave.
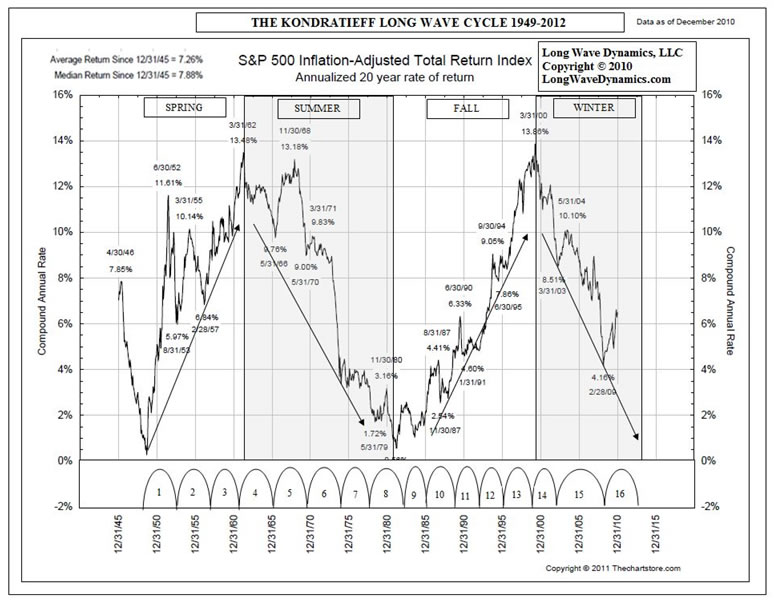
After two decades of stock market cycle research from a dynamic systems approach, I have come to endorse Wall’s approach to the business cycles that produces what I have termed long wave dynamics. Below is a chart that presents an inflation adjusted 20-year moving average of returns in the S&P 500. This chart knocks out some of the noise produced by fiscal and monetary intervention, which is for the express purpose of eliminating business cycle; a goal that always manages to elude the interventionist, no matter how well intended their gallant stimulus efforts. PQ Wall was fond of saying, “Politics destroys the money world.” The riots sweeping the world and subsequent tumbling markets demonstrate this observation.
The analytical power of the four-season approach to long wave analysis is clear on this chart. It is also clear on this chart that global stock markets are in the midst of a winter season rally that will surely wane. The spring and fall are seasons of corporate efficiency, which drive corporate profits and stock market gains. The summer and winter are seasons of corporate inefficiency, where overproduction and excess debt are a drag on the profits of the global economy. More debt is not the solution. It is winter, but spring is coming.
To understand the dynamics of business cycles, and how they fit in long waves, a closer look is required at the length of a regular business cycle. Most analysts have observed that the business cycle typically does not manifest in exact lengths, fluctuating within a range. Kitchin himself believed they averaged 40 months. In the footnote on page 174 of the two-volume 1939 edition of Business Cycles, Schumpeter conveys that the most valued assistant that Kitchin ever had:
“threw up his hands in holy horror when he expressed himself satisfied, in a certain case, with a periodicity of 48 months as showing the presence of the 40-month cycle.”
Many market cycle analysts have experienced this same frustration in grappling with cycles and their lack of consistent length, particularly the regular business cycle. Schumpeter provides additional review of research on the expected length of regular business cycles:
“The 40-month cycle, although first none too favorably received, has since acquired citizenship which, as we shall see, cannot reasonably be questioned. Professor Mitchell’s authority may, it seems, be appealed to for qualified support (op. cit. pp. 339 and 385), based upon analysis of five American systematic series (among them, two of clearings and one of deposits) for 1878-1923, which gives a mean duration (of cycles in general) of 42.05 months with a standard deviation of 12.37 months, while the median is 40 months.”
It is important to note that Kitchin, Mitchell and Spengler were analyzing business cycle data from the late 1800s and early 1900s, most of the business cycles they studied occurred prior to the creation of the Federal Reserve System. This was also a time before government interventionism and central banks began a systematic attempt to stamp out business cycles, blaming their existence on animal spirits. The conviction remains that such animal spirits can be appeased, with appropriate Keynesian black magic. Research by Jay Forrester in the System Dynamics program at MIT indicates that such intervention makes business cycles and long waves run longer, only delaying the day of reckoning.
A dynamic approach to business cycles suggests the radical notion that there is such a thing as natural length that produces an ebb and flow to business cycles, and that cycles fluctuate around that natural length. Cleary business cycles are running longer than their natural lengths since central banks and governments began to come to the rescue. This fact is important for any dynamic analysis of business cycles. Since this long wave began in 1949 the Kitchin cycle has averaged almost exactly 48 months.
The 48 month of the election cycle clearly has produced a gravitational pull since the politicians have used their post-depression intervention to try and stamp it out, especially in election years. Based on 2008, the politicians appear to have lost control of the business cycle, and now Russian economist Kondratieff is in the driver’s seat of international free market capitalism. The mother of all business cycles, driven by the U.S. housing bubble, crashed and burned into the March 2009 low. Forget the animal spirits; Nikolai Kondratieff is now at the wheel of a global overproduction and debt crisis that threatens a global trade war. Once we return to truly limited government, and it is coming, the business cycles will return to a natural shorter rhythm.
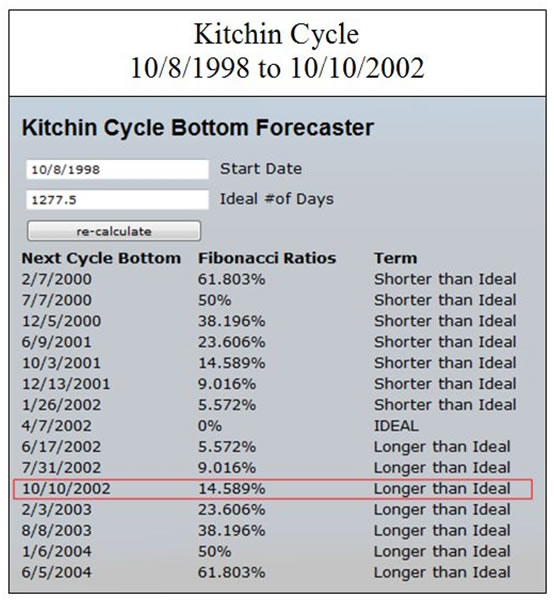
In the 1990s, I began researching business cycles and their corresponding stock market cycles in pursuit of the “natural” or ideal length of cycles. This was accomplished by searching for hits on Fibonacci ratios around a specific length. Using the logic presented above regarding the 42.05-month mean length of the cycle and other literature an exact 42-month cycle was tested. I was looking for Fibonacci ratio deviation hits from that ideal length in the real stock market data.
A 42-month Kitchin cycle produced many hits, often in the same week of the Fibonacci ratio date targets relative to the ideal target, or hits on or close to the Level 2 targets. The Level 2 targets are the Fibonacci targets between two Fibonacci targets. Below is the Kitchin cycle forecaster that shows a direct hit on the fifth degree 14.589% Fibonacci ratio target in the Kitchin cycle that lasted from the low on 10/8/1998 to the low on 10/10/2002. It produced an exact date hit. If you recall those two days, they were important stock market cycle lows that ended the old and began the new Kitchin cycle. The stock market cycles do not match the economic business cycles exactly.
The Kitchin cycle is a cycle that investors need to pay close attention to at all times. The Kitchin cycle rolls over 16 times every long wave, and wreaks havoc with investors and traders. What is most interesting for traders is that every Kitchin cycle divides into nine Wall cycles. Investors and traders will recognize this cycle as the 20-week cycle.
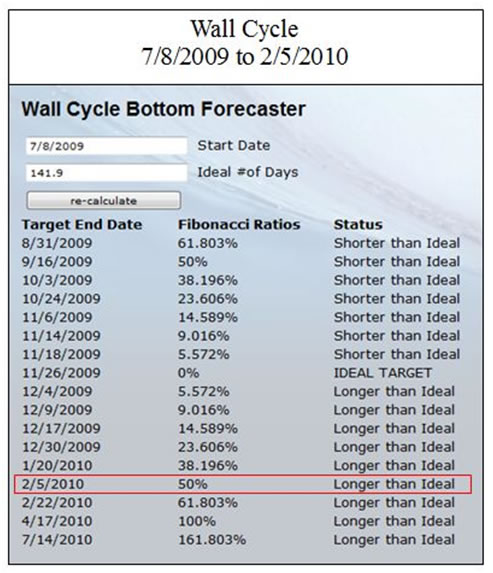
Using the 42-month “ideal” cycle makes the “ideal” or “natural” Wall cycle 141.9-days. Like the Kitchin cycle, the Wall cycle tends to fluctuate in Fibonacci ratios around the ideal lengths. Since monetary and fiscal stimulus is expanding the Kitchin cycles, and making them run long, it is also expanding the Wall cycles. They often run long in exact Fibonacci ratio extensions. Below is the cycle forecaster for the Wall cycle that began on July 8, 2009 and ended on February 5, 2010. All Wall cycles are not all this accomodative with the Fibonacci Wall cycle bottom forecaster, but often come very close.
Combining cycle tracking in time with Fibonacci ratio extensions of the natural stock market cycles with Fibonacci drill-down grids in price is the essence of cycle research. Investors and traders can track stock market cycles with these methods, providing for entry, exit and stop loss strategy to reduce risk and improve performance.
The global economy is now in a topping process in the final business cycle and stock market rally in the long wave that began in 1949. The long wave winter is the season of overproduction and debt deleveraging. The long wave winter season is in its final years, and they will be devastating for investors and traders that are not prepared.
Global stock markets face long wave forces into an expected late 2012 long wave bottom. An important global stock market top is in the cards, and it could be sooner rather than later. The final leg down of the long wave winter season will derail the global stock market rally and could financially devastate unsuspecting investors and traders. The approach to long wave cycle analysis described in this article is fully explained in Jubilee on Wall Street (2009).
Tracking the global stock market cycles in price and time is essential for serious investors and traders. Joseph Schumpeter was a remarkable business cycle analyst, but the late great stock market cycle analyst PQ Wall wins the long wave business cycle count debate. There are 16 business cycles in a long wave. The current and last Kitchin cycle in this long wave is set up to roll over into 2012.
David Knox Barker is a long wave analyst, technical market analyst, world-systems analyst and author of Jubilee on Wall Street; An Optimistic Look at the Global Financial Crash, Updated and Expanded Edition (2009). He is the founder of LongWaveDynamics.com, and the publisher and editor of The Long Wave Dynamics Letter and the LWD Weekly Update Blog. Barker has studied and researched the Kondratieff long wave “Jubilee” cycle for over 25 years. He is one of the world’s foremost experts on the economic long wave. Barker was also founder and CEO for ten years from 1997 to 2007 of a successful life sciences research and marketing services company, serving a majority of the top 20 global life science companies. Barker holds a bachelor’s degree in finance and a master’s degree in political science. He enjoys reading, running and discussing big ideas with family and friends.
© 2011 Copyright David Knox Barker - All Rights Reserved Disclaimer: The above is a matter of opinion provided for general information purposes only and is not intended as investment advice. Information and analysis above are derived from sources and utilising methods believed to be reliable, but we cannot accept responsibility for any losses you may incur as a result of this analysis. Individuals should consult with their personal financial advisors.
© 2005-2022 http://www.MarketOracle.co.uk - The Market Oracle is a FREE Daily Financial Markets Analysis & Forecasting online publication.