Gold is Bottoming, Longs Will Be Rewarded Soon
Commodities / Gold and Silver 2011 Feb 02, 2011 - 02:46 AM GMTBy: David_Banister
 My more recent forecasts for Gold were intermediately bearish from the $1390’s area as we saw a clear triple top breakdown from the 1425-1430 ranges about 8 weeks ago. However, the drop to $1310 fulfills a potential Fibonacci pivot low according to my Elliott Wave views on Gold, and investors can begin building long positions with the following views in mind if I’m right.
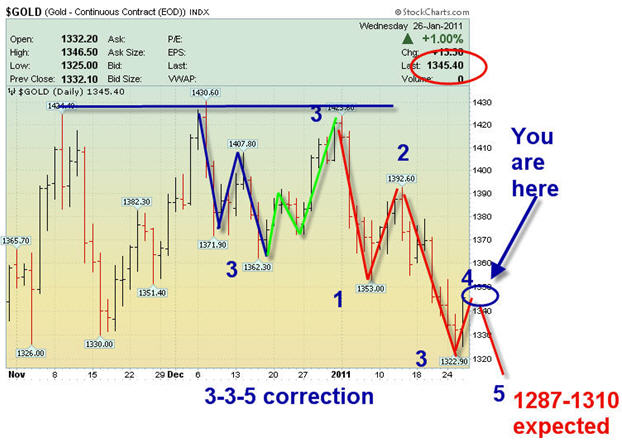
The rally up from the February 2010 $1,044 lows has been a large “Wave 3” structure which is not yet complete. We have completed 3 of the required 5 waves for this structure, and the current correction is a 4th wave. This pattern looks like what I call or Elliott termed a “3-3-5” pattern. This means you see 3 waves down, 3 waves up, and then 5 waves down to complete the correction. Note below the chart I sent my subscribers several days ago forecasting a possible pivot at $1310:

Now, as you can see above we did end up dropping back down from $1,345 an ounce to $1,310 last week and pivoted higher. This confirms a possible 4th wave bottom after a 7-8 week correction period. This type of movement works off the overbought sentiment levels of traders. In addition, we had the exchanges increasing position limits in the New Year and caused some additional liquidation selling.
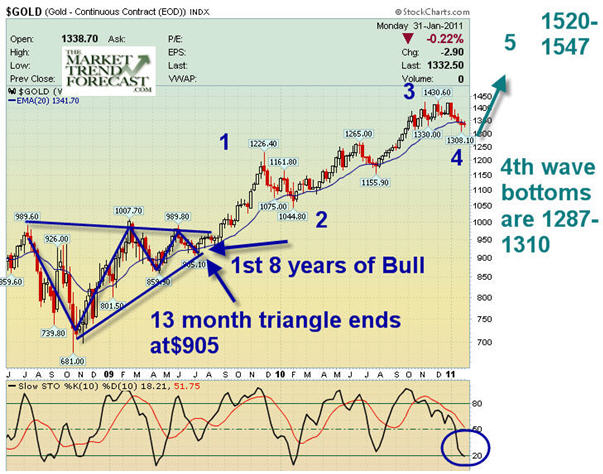
The long term views now are for $1287 to hold as a worst case bottom in this 4th wave, and the 5th wave to begin if it has not already to over $1,500 per ounce at the next interim highs. I expect this could take quite a few months before we can even consider attacking the $1430 areas, but in time we should climb back above that wall. See my updated long term Elliott Wave based chart below. The general advise for traders is to take a long position with a stop at $1285, but add to your position on any tests of $1310 and down to $1287.
Gold is in a 13 Fibonacci year bull market. This is much like the Tech Stock bull from 1986-1999 in fact, and this would be similar to 1997 in the Tech Bull, still a lot of room on the upside to come for both Gold and Gold Stocks yet. The Fibonacci 8 year period ended around $905 last August, which is when I forecasted a huge 5 year bull run in gold and gold stocks to commence. Don’t fall off the wagon on the shakeouts.

If you would like to benefit from learning more about my methods, which have been historically accurate, please check us out at www.activetradingpartner.com There is a coupon available if you’d like to subscribe and save $150 just email me at Dave@ActiveTradingPartners.com or you can sign up for free occasional reports.
Dave Banister
CIO-Founder
Active Trading Partners, LLC
www.ActiveTradingPartners.com
TheMarketTrendForecast.com
Dave Banister is the Chief Investment Strategist and commentator for ActiveTradingPartners.com. David has written numerous market forecast articles on various sites (SafeHaven.Com, 321Gold.com, Gold-Eagle.com, TheStreet.Com etc. ) that have proven to be extremely accurate at major junctures.
© 2011 Copyright Dave Banister- All Rights Reserved
Disclaimer: The above is a matter of opinion provided for general information purposes only and is not intended as investment advice. Information and analysis above are derived from sources and utilising methods believed to be reliable, but we cannot accept responsibility for any losses you may incur as a result of this analysis. Individuals should consult with their personal financial advisors.
© 2005-2022 http://www.MarketOracle.co.uk - The Market Oracle is a FREE Daily Financial Markets Analysis & Forecasting online publication.


