Stock Market Indexes Look Like April 2010 Correction
Stock-Markets / Stock Markets 2011 Feb 06, 2011 - 05:34 AM GMTBy: David_Grandey
 The charts of the indexes today remind us of April 2010 where the indexes chewed around for what seemed like eternity before rolling over.
So let’s explore that statement shall we? Below are the S&P 500 and OTC Comp charts of the April 2010 highs.
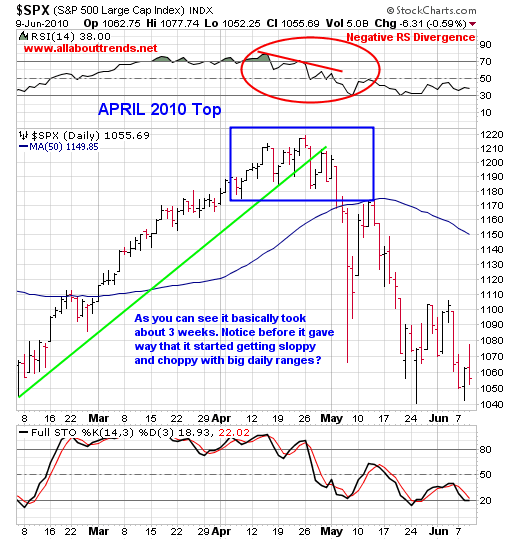
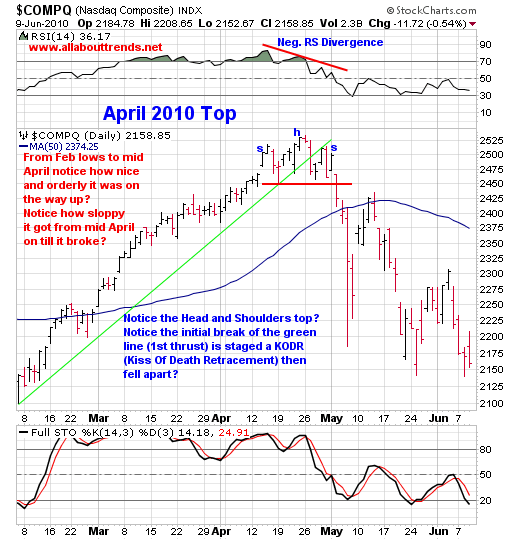
One thing we want you to notice is that of the so called flash crash. Not so much that, but the bounce back up. In each index notice where it stopped? You got it right to the 50-day average in each index then promptly rolled right back over — that’s common. Not to mention the OTC came right back up to basically test the neckline of the choppy and sloppy head and shoulders top.
Moving on to our current environment below are the OTC Comp and RUT 2000.
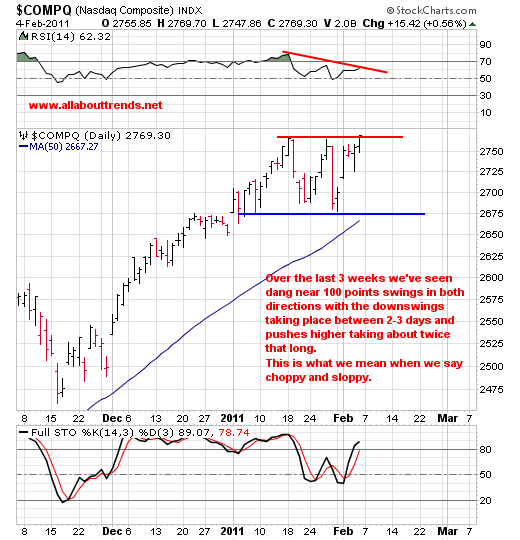
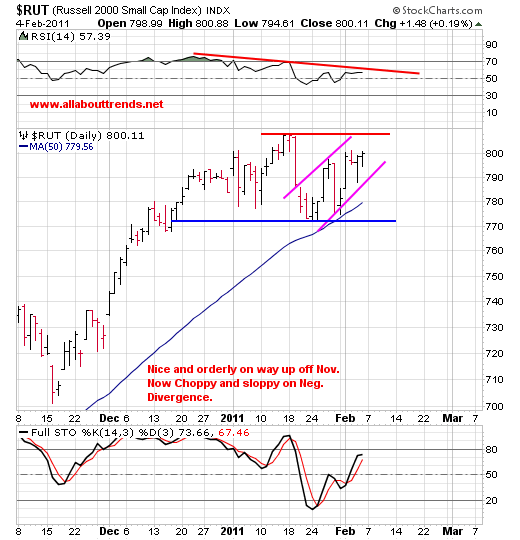
While we are at it let’s take a look at GLD, specifically the 3 drives to a top during Nov. And Dec. which reminds us of the OTC and RUT charts above and the April 2010 slop before the drop examples.
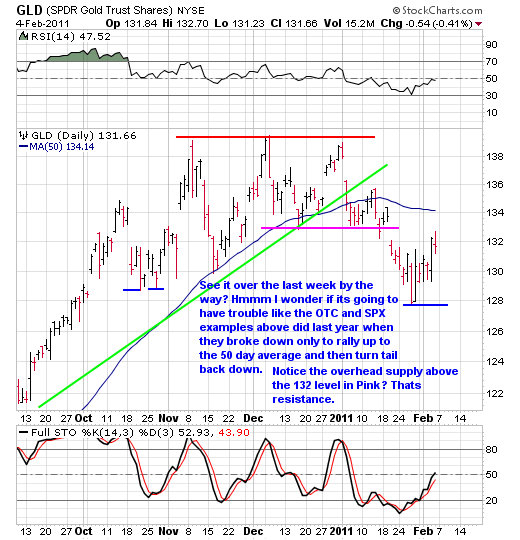
If you get a chance take a look at SLW, it’s rallied right up to the 50 day already.
The S&P 500 and Dow Industrials don’t show the slop before the drop currently but what they do show is that incessantly clinging to the trend channel resistance line — again the monkey can flip the switch at any time so be aware.
By David Grandey
www.allabouttrends.net
To learn more, sign up for our free newsletter and receive our free report -- "How To Outperform 90% Of Wall Street With Just $500 A Week."
David Grandey is the founder of All About Trends, an email newsletter service revealing stocks in ideal set-ups offering potential significant short-term gains. A successful canslim-based stock market investor for the past 10 years, he has worked for Meriwest Credit Union Silicon Valley Bank, helping to establish brand awareness and credibility through feature editorial coverage in leading national and local news media.
© 2011 Copyright David Grandey- All Rights Reserved Disclaimer: The above is a matter of opinion provided for general information purposes only and is not intended as investment advice. Information and analysis above are derived from sources and utilising methods believed to be reliable, but we cannot accept responsibility for any losses you may incur as a result of this analysis. Individuals should consult with their personal financial advisors.
© 2005-2022 http://www.MarketOracle.co.uk - The Market Oracle is a FREE Daily Financial Markets Analysis & Forecasting online publication.


