


Gold Bottoms and Moving Higher But on Low Volume
Commodities / Gold and Silver 2011 Feb 07, 2011 - 03:23 AM GMTBy: Merv_Burak

 Gold bottomed and looks to be moving higher BUT the volume is just not there to be encouraging. The next week or so will tell us if it is going towards higher levels or if the downside will continue.
Time constraints and no chit chat this week, just the facts.
GOLD : LONG TERM
Well, the P&F advice to wait for the $1320 support to be broken, with a move to $1305, before going P&F bearish is working, so far. The final support is still holding so we’ll keep our fingers crossed hoping that now we can go into higher ground. With the turmoil in the Middle East I would have expected a more exuberant gold move but it does what it has to do to confuse most traders.
My normal indicators are still giving us a positive reading. Gold bounced off its long term moving average line and remains above the line. The moving average line itself is still in a positive trend. The long term momentum remains in its positive zone although it has decline quite a bit from its high and remains just a hair below its negative sloping trigger line. The volume indicator continues to drift sideways and is sitting right on top of its still slightly positive trigger line. All in all the long term rating remains BULLISH.
INTERMEDIATE TERM
Unfortunately the intermediate term is not as positive as was the long term. Gold is still below its negative sloping moving average line. The momentum indicator is, however, in its positive zone (just slightly) and above a positive trigger line. The volume indicator is zigzagging above and below its trigger line ending the week just below the line with the line continuing in a negative direction. Putting all this together we are neither bullish nor bearish but are at a – NEUTRAL rating for the intermediate term. The short term moving average line is still some distance below the intermediate term line and not yet ready to confirm any upgrade in rating.
SHORT TERM
One might be encouraged by the actions of gold to stage somewhat of a bottoming and rally event but I’m not yet fully convinced that the turn around is here. The biggest worry is the lack of upside volume action. Bull moves rarely last without the backing of increasing upside volume action. As we see in the chart the recent volume is below is average volume from the past 15 days, which included a good portion of the downside trend. But let’s look at the indicators and see if they might give us a more encouraging assessment.
Gold has moved above its short term moving average line and the line has just turned to the up side. The momentum indicator is still just slightly in its negative zone but it has been moving upward and remains above its positive sloping trigger line. As mentioned earlier the volume action leaves a lot to be desired. From these indicators the short term rating is just barely in the BULLISH camp. It could change very quickly. The very short term moving average line has just crossed above the short term moving average for a confirmation of this bull.
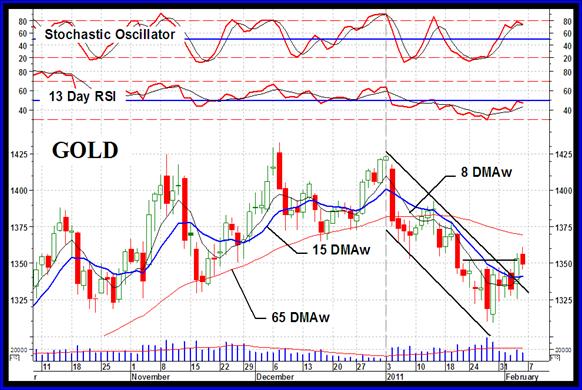
Other signs of note are the breaking, to the up side, of the down trending channel and above a very short term resistance. These are positive signs but I’d like to see some better upside action. Still, the indicators are pointing, however minimally, to the up side.
As for an immediate direction of least resistance, I’ll go with the lateral. Although we do seem to be in a short term up trend the Stochastic Oscillator appears to be in a turning mode and the Friday gold close was to the down side. Maybe the down side is the more realistic but I’ll go with the lateral.
SILVER
From a P&F stand point silver made a 6 unit drop but quickly recovered 5 of those units to the Friday close. Although the drop did signal a bear trend the quick reversal may put that signal in jeopardy. The actions this week will probably either confirm the bear or nullify the signal.
On the long term silver is still far away from any reversal. It remains BULLISH.
On the intermediate term silver, although having showed signs of weakness, is back on track for now. The price was in a downward trend for weeks and did move below its negative moving average line but the recent bounce has taken silver back above the line and the line has just turned to the up side. Throughout this recent weakness the momentum indicator remained in its positive zone. It had been moving lower and had been below its negative trigger line but is once more above the trigger and the trigger has turned back to the up side. The volume indicator is still below its trigger line and the trigger remains pointing downward so we need a little more upside action here to get too bullish. In the mean time the rating has now gone back to the BULLISH side. This is not yet confirmed by the short term moving average line as it is still below the intermediate term line.
On the short term the only indicator that is still giving us a concern is the daily volume action. We need more speculators jumping in. In the mean time silver is moving higher above its positive short term moving average line. The momentum indicator has moved into its positive zone and is moving higher above its positive trigger line. From the indicators one can only rate the short term as BULLISH. This rating is confirmed by the very short term moving average line moving above the short term line.
PRECIOUS METAL STOCKS
A TALE OF TWO INDICES
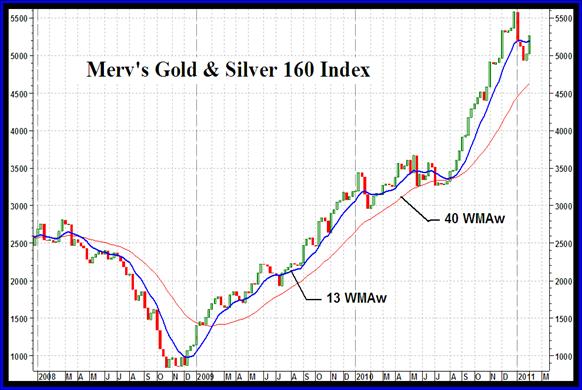
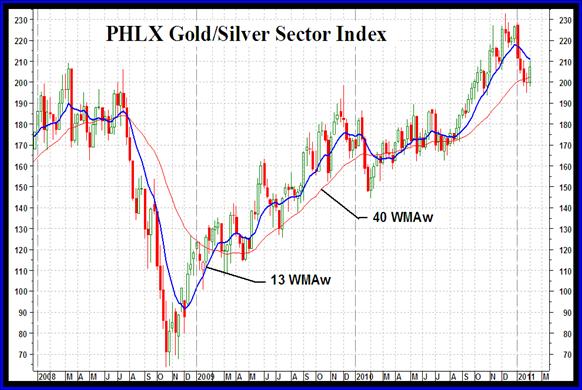
What we have here are two Indices charted from the previous bull market high to the present. It is really a tale of two Indices. One is the PHLX Gold/Silver Sector Index, the most popular North American major Gold Index and the other is the Merv’s Gold & Silver 160 Index. What a difference in performance between the two. The PHLX closed on Friday just 0.4% above its 2008 bull market weekly high close while the 160 closed on Friday 88% above its 2008 bull market weekly high close.
During the bear market of 2008 both declined almost the same amount, PHLX down 67% while the 160 was down 71%. On the other hand, during the bull market since the lows of 2008 the PHLX advanced 193% while the 160 Index advanced 523%, quite a difference.
What is the difference? The PHLX is composed of about 17 of the largest and/or highest “quality” gold stocks while the 160 is composed of the top 100 gold stocks (by market value) traded on the North American exchanges plus 60 additional stocks, some of a more speculative variety. Note that real penny stocks are not included here but are included in my Merv’s Penny Arcade Index. The 160 Index really far better represents the overall gold and silver stock market.
There is another major difference in the two Indices, the method of calculating the Index value. The PHLX is calculated using a weighting method that places greater emphasis on the larger stocks and lesser emphasis on the smaller stocks in the Index. As an example, the top 4 stocks represent about 65% of the Index value. The top 2 stocks alone represent 40% of the Index value. By comparison the 160 Index is calculated based upon the average weekly performance of all stocks in the Index. No stock has any greater value towards the Index than any other stock. Each stock represents 0.625% of the Index value no matter the size or “quality” of the company.
I just bring this up so that when you read an analysis of the gold market which makes reference to one of the major North American Indices you should know that the Index represents basically the performance of only a very few of the largest stocks in the Index and may not represent what is happening to the overall gold and silver stock industry.
Some might say I should have used the ACRA Gold BUGS Index or the Market Vectors Gold Miners Index but they are not that much different from the PHLX to make a difference in the commentary comparison.
Merv’s Precious Metals Indices Table
Well, that’s it for this week. Comments are always welcome and should be addressed to mervburak@gmail.com.
By Merv Burak, CMT
Hudson Aero/Systems Inc.
Technical Information Group
for Merv's Precious Metals Central
For DAILY Uranium stock commentary and WEEKLY Uranium market update check out my new Technically Uranium with Merv blog at http://techuranium.blogspot.com .
During the day Merv practices his engineering profession as a Consulting Aerospace Engineer. Once the sun goes down and night descends upon the earth Merv dons his other hat as a Chartered Market Technician ( CMT ) and tries to decipher what's going on in the securities markets. As an underground surveyor in the gold mines of Canada 's Northwest Territories in his youth, Merv has a soft spot for the gold industry and has developed several Gold Indices reflecting different aspects of the industry. As a basically lazy individual Merv's driving focus is to KEEP IT SIMPLE .
To find out more about Merv's various Gold Indices and component stocks, please visit http://preciousmetalscentral.com . There you will find samples of the Indices and their component stocks plus other publications of interest to gold investors.
Before you invest, Always check your market timing with a Qualified Professional Market Technician
Merv Burak Archive |
© 2005-2022 http://www.MarketOracle.co.uk - The Market Oracle is a FREE Daily Financial Markets Analysis & Forecasting online publication.