


Pricing the World in Gold
Commodities / Gold and Silver 2011 Feb 10, 2011 - 03:12 AM GMTBy: Adrian_Ash

 Equities, housing, commodities and bonds viewed through the prism of what money once was...
WHAT WOULD the world look like if, as a handful of economists, investors and politicians hope, gold really was money again?
In a word, cheap...ish. Cheaper, at least, than much of it was a decade ago.
Long used (together with silver) as a means of exchange and unit of account, gold had already lost those functions by the time it ceased backing the world's currency system in 1971. But gold retains the third function of money - as a store of value - now beating, now lagging the unbacked fiat money (i.e. created at will) which replaced it.
Since then, gold's value has also varied more widely against other, competing stores of wealth as well as cash, amplifying the swings in its relative worth against equities, real estate, commodities and government bonds.
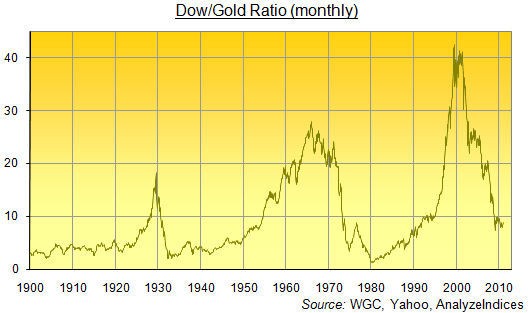
Perhaps you've seen the above chart before, for instance. Simply dividing the Dow Jones Industrial Average by the Dollar-price of gold per ounce, the Dow/Gold Ratio might sound an arbitrary yard stick. But it tracks the relative worth of US equities against an increasingly popular, if still minority store of wealth, gold bullion. Dividends are excluded, leaving just the market-price - rather than income or earnings potential - of business assets in the world's largest economy, measured by a lump of dumb metal.
Why? Because unlike corporate equity, gold doesn't do much. It can't even rust, much less grow (or shrink) its return-on-capital-employed. And from the recent low (7.2 ounces per Dow unit, hit in Feb.2009), US stocks have gained 20% vs. gold. (Priced in nominal dollars, they've risen 73% in the last two years.) The historic low stands beneath two ounces of gold, the all-time high above forty. Today, the Dow/Gold Ratio sits just shy of nine - a little beneath its 12-decade average of ten.
Note those two lows (or rather, peaks for gold ), hit in the mid-1930s and early '80s. Because they show up elsewhere, as well.
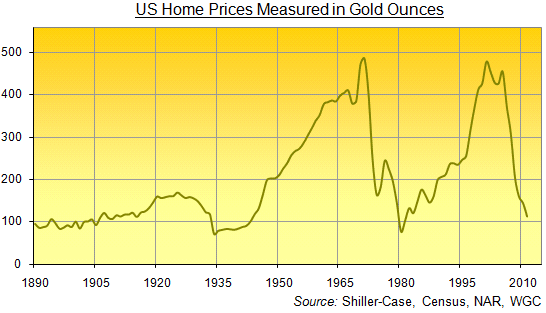
The average US home - a term so broad, it's quite possibly worthless beyond the very broadest historical sweep - has averaged 202 ounces of gold over the last 120 years, at least on the data we've constructed from a collection of sources to cover more than a century's worth of different housing, styles, sizes, locations and amenities.
Let's put the methodological doubts to one side, though. Currently priced around 112 ounces, US housing hasn't been this cheap in three decades, dropping over 75% from the 2001 high (478 ounces; the 1971 peak was 485 ounces). Returning to the very lowest prices on BullionVault's series would see residential property lose another third. It hit 77 ounces in 1980, just above the 1934 low of 71 ounces. Whatever the national US housing stock gained in utility or comfort over that time, in short, unrusting gold priced it just as lowly amid first a deflationary and then an inflationary depression.
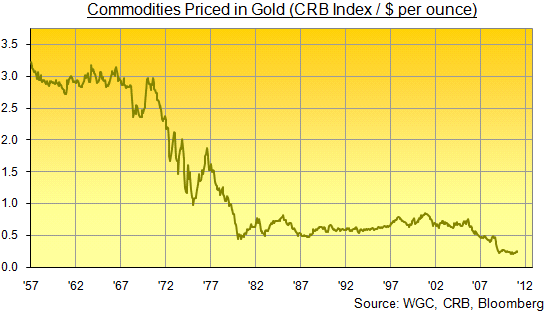
Commodities are a separate matter. Because they have never been cheaper in terms of gold, slumping by more than 70% since 2001, even as the much-touted "commodity super-cycle" took energy, base metal and now food prices to record highs in terms of the Dollar.
Buying commodities in the hope of growing your capital means you're "selling human ingenuity" reckons SocGen strategist Dylan Grice, and (over the last 300-odd years) he's got a point. Because raw materials are "generally cheaper to produce over time [as] human innovation has lowered the cost of production." Yet ironically, Grice's point is best made in gold, that least ingenious, least human of all pricing yard sticks. Indeed, the difference between gold-priced commodities and gold-priced stocks or housing is that raw materials failed to surge and recover their previous highs after the 1970s' bear market. For the last six decades and more, gold has grown consistently more valuable in terms of the world economy's natural-resource inputs.
Our chart takes the Reuters-Jefferies CRB index - a weighted basket of the 19 most heavily traded raw materials, including aluminum, crude oil, live cattle, orange juice, and gold itself - and divides it by the Dollar-price of gold. As with housing and stocks, gold's most dramatic gains and highest valuations came during economic turmoil, outpacing the price of industrially useful natural resources even amid the severe cost-inflation of the 1970s as well as during the last four years of global financial crisis. Further back, once again, the Great Depression also saw gold's relative worth rise sharply against raw materials, as commodity prices sank but gold was revalued higher by governments, who - then tied to its physical limits as money - were desperate to devalue currency and so reduce debt burdens in a bid to reflate the economy.
Last in our little survey of gold's relative worth, therefore, come government bonds. There's a problem here, because governments are constantly paying old and raising new debt, issuing bonds with a vast range of maturity dates which (unless they default) all revert in the end to par value, redeeming $100 (or £100, €100 and so forth) for every $100 originally lent by investors.
A broad price basket is hard to construct, in other words, with the various indices - such as those offered by S&P and Dow Jones - also including annual yields to give "total returns", and only running back a few years at best.
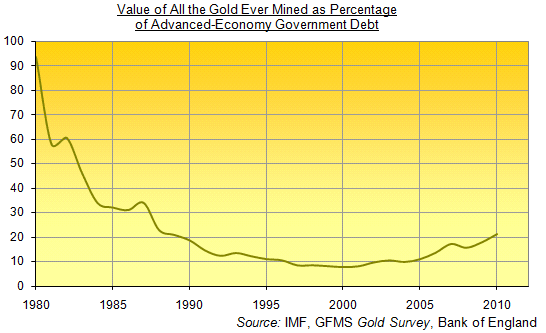
One solution is to weigh gold's total value against the sum total of debt outstanding - the par value of government bonds in issue. Data from the International Monetary Fund, running from 1980, at least enables us to cover the world's "advanced" economies. And here, based on what we may as well call the "market capitalization" of gold - and in contrast to stocks, housing and industrially useful resources - government debt looks very highly priced, albeit on a mere three-decade horizon.
All the gold above-ground - swelling to some 165,000 tonnes or more today, and including central-bank reserves and that mass of jewelry used to store wealth in Asia, as well as the coins and gold bars more typically favored by Western investors - has been swamped, in terms of relative value, by advanced-economy government debt. Back in 1980, their nominal cash values were pretty much identical. Yet the doubling of gold's Dollar-price from that year's (then) record high, plus the two-thirds increase in above-ground gold stockpiles over the last 30 years, has still left the metal worth less than one quarter of what it was at the start of the '80s in terms of rich-world government debt.
That debt, now 18 times larger in Dollar terms at $36 trillion, has swollen from 25% of those rich-world economies' GDP to more than 87% of their annual output. There's very much more of it around in 2011 than in 1980. On a relative basis - and given that the par value of debt outstanding cannot fall without default or "restructuring" - gold's steady appreciation against equities, US housing and raw materials has barely begun to play out against government bonds.
By Adrian Ash
BullionVault.com
Gold price chart, no delay | Buy gold online at live prices
Formerly City correspondent for The Daily Reckoning in London and a regular contributor to MoneyWeek magazine, Adrian Ash is the editor of Gold News and head of research at www.BullionVault.com , giving you direct access to investment gold, vaulted in Zurich , on $3 spreads and 0.8% dealing fees.
(c) BullionVault 2011
Please Note: This article is to inform your thinking, not lead it. Only you can decide the best place for your money, and any decision you make will put your money at risk. Information or data included here may have already been overtaken by events – and must be verified elsewhere – should you choose to act on it.
© 2005-2022 http://www.MarketOracle.co.uk - The Market Oracle is a FREE Daily Financial Markets Analysis & Forecasting online publication.