


Gold Bull Market Parabola
Commodities / Gold and Silver 2011 Feb 13, 2011 - 02:58 PM GMTBy: Lorimer_Wilson

 GoldRunner writes: Gold is in an historic Bull Market because most nations are printing their paper currencies like they are going out of style (and maybe they are) as each nation tries to battle off the massive deflationary backdrop of debt that has permeated most of the world. This surge of debt monetization - this devaluing of the U.S. Dollar for one - has set the scene for a parabolic rise in $Gold to $1860, or higher, over the coming months before an intermediate-term correction takes place. Let me explain.
Just today, I read that the Fed has announced that they will buy back $97 Billion of Treasury debt next month which will be an increase in U.S. Dollar (Dollar) inflation next month akin to 25% of the $397 Billion the Fed has already done over the last 7 months since August. This is what the Fed calls QE II, pure debt monetization where new Dollars are printed up and used to buy back our Nation's debt. This is pure Dollar inflation that devalues the Dollar by aggressively increasing the Dollar supply.
This surge of debt monetization by the Fed comes with $Gold having suffered a rather mild correction up at all-time highs. Overall, the Parabolic rise in $Gold appears to be accelerating on the chart as the corrections appear to be getting shorter in time and more shallow in terms of price. This is how a parabolic rise takes place. This also shows how the psychology of investors is changing toward $Gold. The price of Gold slurs and chops higher on the chart as investors' fear of the supply of Dollars being printed keeps on rising. U.S. investors are increasingly becoming concerned about how the increasing supply of Dollars is devaluing the Dollar affecting everything in their lives - the buying power of their income, the stability of their jobs, the worth of their possessions, and of the value of their savings.
The US Dollar Index Does NOT Accurately Track the Devaluation of the Dollar
I find it fascinating to watch the Dollar Devaluation and the Gold Parabola play out. It is a continuing sketch of denial turning into reality. The Gold Bull is climbing very similarly to how it climbed in the late 70's. Investors seem to primarily be watching the Dollar Index in an attempt to track the devaluation of the Dollar. Unfortunately, that simply will not work in an environment where most nations are aggressively printing their paper currencies. It did not work in the late 70's, either.
When most countries are aggressively printing their paper currencies, a period of Global Competitive Currency Devaluations, the Dollar is being measured in the Dollar Index against a basket of other currencies that are also constantly falling in value. You cannot use a reference point that is constantly falling to determine the Dollar's value because it negates the reason for a reference point in the first place. Thus, the Dollar Index is simply a "pricing mechanism" measuring the Dollar against other paper currencies that are falling in value. The Dollar "pricing index" becomes worthless as a gauge of U.S. "Dollar Value" in these times, just like it did back in the late 70's.
The $Gold Chart is the ONLY True Comparison of Dollar Value
The only true reference point of value for the Dollar at this time is a comparison to Gold. Thus, the $Gold chart is that only true comparison of Dollar Value as it is viewed in a ratio to relative constant value Gold once Global Competitive Currency Devaluations are ongoing. Smart money knows this so to a large extent the rise in the parabolic Gold Bull feeds on itself. Yet, the psychology that drives Gold higher is constantly fed by the fundamental facts of Dollar supply expansion such as the Fed's recent announcement that debt monetization will be ratcheted up next month.
At a very similar point to today in the 70's Gold Bull chart, Gold accelerated to the upside very sharply out of a similar bottom. The 1970's move rose up to a point about 30% higher than the "last high." If we see the same rise over the coming months a 30% rise would take $Gold up to around $1,860. Yet, there are different ways of arriving at a potential target, and some of them suggest a potential for Gold to rise over the coming months to an even higher target before an intermediate-term correction takes place.
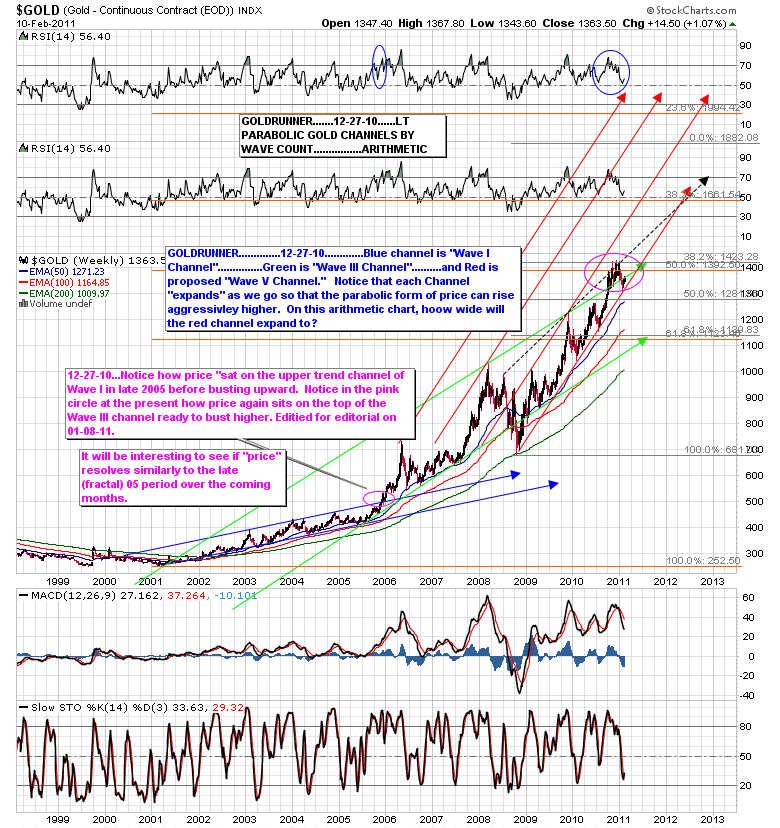
A Look At The Weekly Arithmetic Chart Of $Gold
In the first chart below we can see that the recent correction fell a bit lower than I had expected. Although the chart of Gold has been playing out very similarly to the late 70's Gold parabola, many of the corrections have been a bit deeper in the current period than those similar points in the 70's Bull. I think that is to be expected. Investors have been constantly hampered by the confusion a deflationary backdrop provides versus the inflationary backdrop of the late 70's. Yet, it is not the backdrop that is driving the price of $Gold ever-higher. What is driving the price of $Gold ever-higher is the Dollar Inflation in response to the massive deflationary backdrop and deteriorating economy. The worse the debt levels and the worse the economy deteriorates; the more Dollar inflation is applied, fueling the $Gold Bull in its parabolic climb.
We can see in the chart that $Gold has risen up out of the top of what I call "The Wave III Channel", much like it did back in 2006 out of the "Wave I Channel." Also, like in 2006, $Gold has corrected back to, and a bit below, the corresponding channel top. $Gold found a bottom at the red uptrend line off of the late 2008 Deflation Scare bottom. At the present time Gold has found a bit of resistance back up at the green line representing the "Wave III Channel Top." If $Gold breaks through that green line as new Dollar Inflation accelerates into next month, I would expect the price of $Gold to resolve sharply to the upside similarly to the sharp move higher back in the late 70's as described, above.
Note in the chart the sharp expansion in channel width between the "Wave I Channel" and "The Wave III Channel." I would expect the price rise into the future to see a similar expansion of "The Wave V" channel defined by the red lines. This is how a parabola grows on an arithmetic chart. Also note how $Gold appears to have bottomed while the RSI reached the 50 line, and the Stochastic indicator turned up. . (For my previous comments on the development of the chart below please go here.)
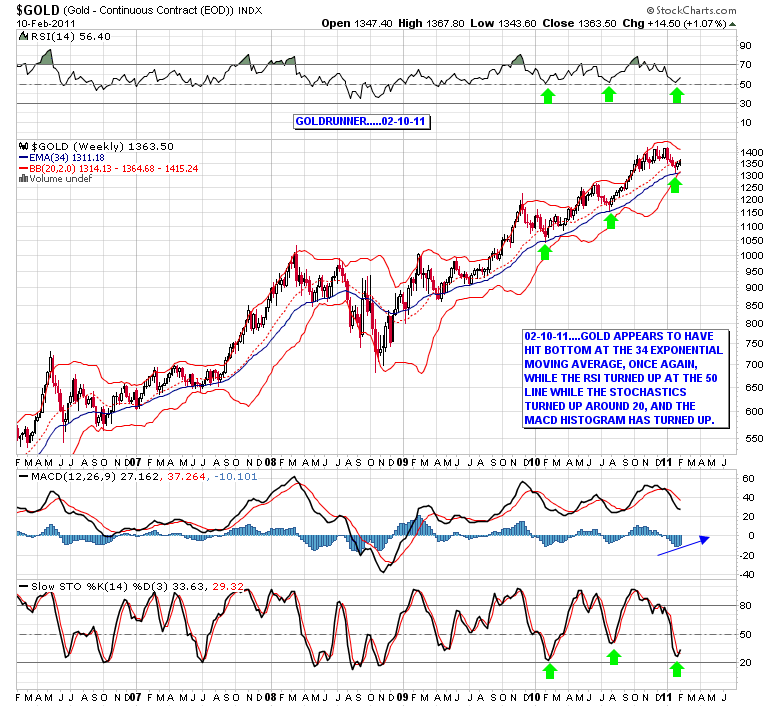
A Look At The Weekly Log Chart of $Gold
The following chart is a weekly log chart of $Gold showing the potential bottom in place. We can see that for the last year, or so, $Gold has tended to bottom with the price dropping below the Bollinger Band mid-line down to touch the 34 week exponential moving average. Then, $Gold rises back up to and above the Bollinger Band mid-line. At each former bottom marked by green arrows on the chart, we can see that the RSI bottomed around the 50 mark while the Stochastic indicator turned up below the 50 line. This is classic bull market behavior at bottoms. We can also see that the MACD histogram has now bottomed- a precursor to the MACD turning up.
The Ongoing Dollar Devaluation Is Driving the $Gold Price
If the late 70's continues to be a good template for the current Golden Parabola that is unfolding, we have a lot higher for $Gold to rise. To be in the Precious Metals sector at this time I think it is imperative to seek out the correct Dollar valuation metrics since it is the ongoing Dollar Devaluation that is driving the $Gold price. Other issues like the massive deflationary backdrop and the deteriorating economy are the reason the massive Dollar Inflation program is being provided. False "pricing mechanisms" like the Dollar Index can be useful at times, but cannot be depended upon if one is seeking the true Dollar Devaluation that is occurring. For instance, from this current juncture in the late 70's the Dollar was devalued a further 60% or so against Gold while the Dollar index fell only a fraction of that amount.
Diminishing Effects Of QE II by June Will Result in an Intermediate-term Gold Correction
I believe the Fed has already given us the basic timing for this run in $Gold to meet an intermediate-term correction. When the Fed announced QE II they said that it would run into early June of this year. Since it is Dollar inflation/ Dollar Devaluation in the form of QE II that is now driving the $Gold parabola, it certainly makes sense that the end of QE II would invite an intermediate-term correction in $Gold. That being said, what we do not know for sure is just how much monetization the Fed will actually provide into June. Look at the Fed providing "guidance" as to how much debt they will monetize next month. They are practically begging the markets, including the PM sector, to rise by providing such guidance. The Fed desperately needs Dollar Inflation to lead to price inflation to counteract the massive deflationary backdrop that exists. Debt monetization as a form of Dollar Inflation is mostly directed at devaluing the Dollar since very little of this form of Dollar Inflation actually enters the economy. Thus, we can count on further economic deterioration to lead to more Dollar Devaluation into the future.
The Prospects for $Silver and the HUI
The prospects for $Silver going forward look to be just as promising, or even more promising, than our expectations for $Gold. Gold in Rand is now hitting the top of its ascending triangle for the 4th time, and the chart of $Gold suggests that Gold in Rand will likely be successful in terms of a break-out to the upside very soon. I will try to return shortly to show our expectations for $Silver, Gold in Rand, and for the PM Stock Indices.
For the moment..... Goldrunner
GOLDRUNNER
Goldrunner has also posted this article on the public side of www.GoldrunnerFractalAnalysis.com which will soon be a subscription website. (Please note that the subscription button on the site is not active at this time.) to be informed as to when the subscription service is available please contact GOLDRUNNER44@AOL.COM.
Lorimer Wilson is the Editor-in-Chief of www.FinancialArticleSummariesToday.com and www.munKNEE.com and will soon be offering a FREE weekly “Top 100 Stock Market, Asset Ratio & Economic Indicators in Review”. To sign up contact him at editor@munKNEE.com .
Disclaimer: Please understand that the above is just the opinion of a small fish in a large sea. None of the above is intended as investment advice, but merely an opinion of the potential of what might be. Simply put:
The above is a matter of opinion and is not intended as investment advice. Information and analysis above are derived from sources and utilizing methods believed reliable, but we cannot accept responsibility for any trading losses you may incur as a result of this analysis. Comments within the text should not be construed as specific recommendations to buy or sell securities. Individuals should consult with their broker and personal financial advisors before engaging in any trading activities. Do your own due diligence regarding personal investment decisions.
© 2005-2022 http://www.MarketOracle.co.uk - The Market Oracle is a FREE Daily Financial Markets Analysis & Forecasting online publication.