Crude Oil and Middle East Crisis Requires Defensive Bias
Stock-Markets / Stock Markets 2011 Feb 24, 2011 - 10:48 AM GMTBy: Chris_Ciovacco
 We head into Thursday’s trading session with an extended market that now has two negative fundamental factors to focus on; the Middle East and rapidly rising oil prices. Regardless of how long oil prices remain elevated, the market sees it as a reason to sell. According to today’s Wall Street Journal:
Oil futures touched $100 a barrel at the New York Mercantile Exchange Wednesday—the highest since before the financial crisis hit in late 2008—before pulling back. Pricier oil drives up the costs of everything from gas at the pump to the raw materials used to make nylon and food packaging. That could mean higher inflation and prompt consumers, who lately have shown more willingness to spend, to cut back their purchases.
On Tuesday and Wednesday, we took some profits off the table based on the “incremental approach”. In terms of strategy, we sold or lightened-up on copper (JJC), agriculture (DBA), technology (QQQQ), mid-caps (IWP), transports (IYT), consumer discretionary (XLY), Malaysia (EWM), and emerging markets (EEM). We still own some of these positions, but our exposure has been reduced and our cash position increased. Depending on how we finish up today, we are open to raising a little more cash, continuing to step away incrementally from risk until the risk-reward profile of the market improves.
In How High Can Stocks Go?, we suggested the market may have trouble surpassing the range between 1,313 and 1,326. We are now back below those levels, which means the market has reversed from a fairly logical region; something that needs to be respected given the recent extended readings of our models (see red area in table).
It always pays to take a step back to a longer timeframe and check on the market health. A high percentage of market participants look only at daily charts. Obviously, a daily chart of the S&P 500 is going to look weak after the last two days, but what about a weekly chart that speaks to the longer-term outlook? We examine two S&P 500 weekly charts below.
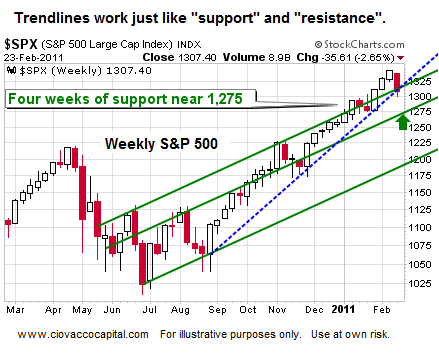
If you understand basic support and resistance, then you also can understand how to use basic trendlines. If the S&P 500 fails to find its footing near the dotted blue trendline below, it may allow for a move back toward 1,275.

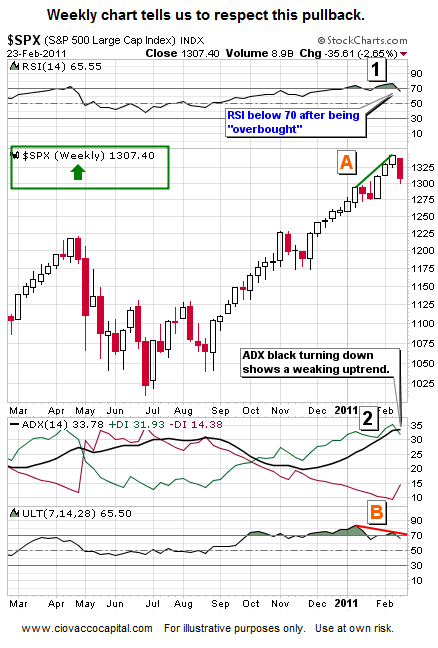
This weekly chart of the S&P 500 does support our risk-reduction moves over the last two days (we also cut back on emerging markets a few weeks ago). The relative strength index (RSI) has moved below 70, which is bearish for the intermediate-term (see 1). Price at point A diverged in a bearish manner from the ultimate oscillator (ULT) at point B. And if you care about trends, as we do, the most concerning thing on the weekly chart of the S&P 500 is the black ADX line turning down from an elevated level (see 2).

How does the chart above relate to our possible strategy going forward? It tells us to be open to further risk reduction should the markets remain weak. If the current pullback morphs into a significant and prolonged correction, the incremental approach will limit the damage. If the market rebounds, we can still participate since we did not make a radical move by going to 50% cash. Most likely, we would cut back further on mid-caps (IWP) and consumer discretionary (XLY) should another step away from risk be needed in the next few days.
By Chris Ciovacco
Ciovacco Capital Management
Copyright (C) 2011 Ciovacco Capital Management, LLC All Rights Reserved.
Chris Ciovacco is the Chief Investment Officer for Ciovacco Capital Management, LLC. More on the web at www.ciovaccocapital.com
Ciovacco Capital Management, LLC is an independent money management firm based in Atlanta, Georgia. As a registered investment advisor, CCM helps individual investors, large & small; achieve improved investment results via independent research and globally diversified investment portfolios. Since we are a fee-based firm, our only objective is to help you protect and grow your assets. Our long-term, theme-oriented, buy-and-hold approach allows for portfolio rebalancing from time to time to adjust to new opportunities or changing market conditions. When looking at money managers in Atlanta, take a hard look at CCM.
All material presented herein is believed to be reliable but we cannot attest to its accuracy. Investment recommendations may change and readers are urged to check with their investment counselors and tax advisors before making any investment decisions. Opinions expressed in these reports may change without prior notice. This memorandum is based on information available to the public. No representation is made that it is accurate or complete. This memorandum is not an offer to buy or sell or a solicitation of an offer to buy or sell the securities mentioned. The investments discussed or recommended in this report may be unsuitable for investors depending on their specific investment objectives and financial position. Past performance is not necessarily a guide to future performance. The price or value of the investments to which this report relates, either directly or indirectly, may fall or rise against the interest of investors. All prices and yields contained in this report are subject to change without notice. This information is based on hypothetical assumptions and is intended for illustrative purposes only. THERE ARE NO WARRANTIES, EXPRESSED OR IMPLIED, AS TO ACCURACY, COMPLETENESS, OR RESULTS OBTAINED FROM ANY INFORMATION CONTAINED IN THIS ARTICLE. PAST PERFORMANCE DOES NOT GUARANTEE FUTURE RESULTS.
Chris Ciovacco Archive |
© 2005-2022 http://www.MarketOracle.co.uk - The Market Oracle is a FREE Daily Financial Markets Analysis & Forecasting online publication.


