The US Fed, The Discount Interest Rate and Market Manipulation
Interest-Rates / US Interest Rates Nov 03, 2007 - 03:37 PM GMTBy: Tim_Wood
 In the wake of the recent Fed meeting and the worldwide attention that it seems to gather these days, I want to address once again the Fed and the Discount rate, but I also want to address manipulation.
First of all, I want to readdress the fact that despite popular opinion, the Fed follows the lead of the short-term credit markets. My Trend Indicator on my Fed model turned down in June, before the first rate cut occurred.
This downturn told us that we had entered into an environment in which future rate cuts should occur. As the equity markets began to decline into August, so did short-term interest rates. In fact, the 3-month T-bill yield went from just over 5% earlier in the year to 4.63% in mid-August. This widened the spread between the Discount rate and the 3-month T-bill rate to 1.62%.
It was then at this time, that the equity markets began to get hit and the Fed stepped in to make the Discount and Fed Funds rate cuts. The spin was and continues to be that they are doing this to support the equity markets. Bologna! They are doing this because the short-term credit markets are forcing them to. They want you to believe that they are doing this to support the equity markets. Thereby, their greatest tool is this perception. If one takes the time to actually stop and study the relationship between the short-term credit markets, the Discount rate and the stock market they would be far better off than just buying the garbage that they hear on TV.
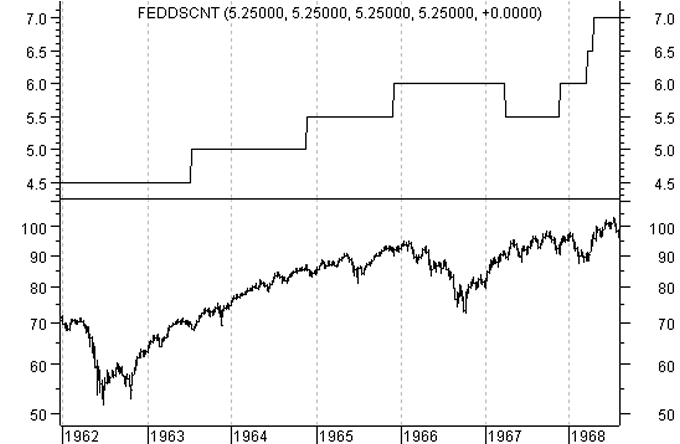
As an example, between 1962 and 1968 the S&P 500 went from 51 to 109. This was a 114% increase in the S&P. Guess what was taking place with short-term rates during this time? They were rising. The Discount rate went from 4.50% to 7.0%. This was an increase of 55% that was dictated by the short-term credit markets. Yes, the Discount rate moved up 55% and the S&P 500 more than doubled. For anyone questioning this data I have included a chart of the S&P 500 along with the Discount rate for this time period below.

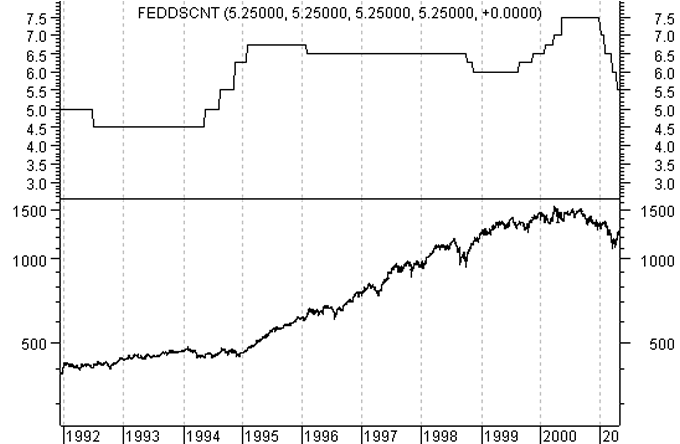
Here is another example. In October 1992 the S&P was at 396 and the Discount rate was at 4.50%. By 2000 the S&P had risen to over 1,500. Guess what happened during this time with the Discount rate? It rose from 4.50% to 7.50%. Yes, this was a 66.67% increase in the Discount rate, which was dictated by the short-term credit markets, and the S&P 500 moved up nearly 300%. Here again, I have included the corresponding charts below.

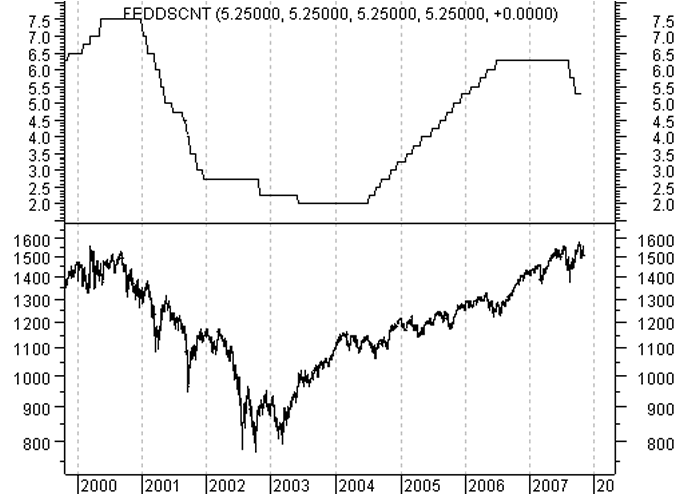
Next, I want to look at the period between 2000 and 2003. This time around the Fed cut the Discount rate from 7.50% down to 2.0%. The equity markets made their bottom in 2002. At that time the Discount rate was at 2.75%. So, in this case the Discount rate was cut by over 63% from the 2000 top into the 2002 stock market bottom, yet the S&P fell just over 50% from its 2000 top down into its 2002 low. Yet, the Fed is accredited with saving the markets during that time frame. This is simply not true. This too can be seen in the chart below. I also want to add that the reason the Fed continued to cut the Discount rate into 2003, well after the stock market bottomed, was because the short-term credit markets dictated those continued cuts. It was not until the 3-month T-bill rates began to rise in early 2004, which forced the Fed to begin raising rates.

What happened between 1962 and 1968 was a series of two consecutively bullish 4-year cycle advances in the equity markets. At the same time, my Fed model clearly indicates that we were in a rate hiking cycle. This was two totally separate and independent events. Between 1992 and 2000, a series of bullishly configured 4-year cycles in the equity markets unfolded. During this time, my Fed model clearly indicated that we were in a rate hiking cycle. Again, this was two totally separate and independent events.
Then, between 2000 and 2002 the 4-year cycle that topped in 2000 was set up to decline below its 1998 low. This call was made by me in the cover story of Technical Analysis of Stocks and Commodities Magazine in 2001 as I was then warning about the decline into the 2002 4-year cycle low. At the time this article was first written, in August 2001, the Industrials were hovering around 10,500 and by 2002 had indeed fallen by over 30%, which took price below the 1998 low just as the statistics surrounding that 4-year cycle suggested. Point being, the die was cast for the decline out of the 2000 4-year cycle top to do exactly what it did and this was documented before hand. The second point here is that during that time the short-term credit markets forced the Fed to cut rates. My Fed model also confirmed that we had entered into another rate cutting cycle at that time. So, the third and most important point here is that once again these were two separate and independent events.
Thus, when one stops long enough to actually look at the facts, it is clear that the Fed wants you to believe that they can control the equity markets by cutting interest rates. This is simply not true. The greatest tool the Fed has in this regard is the perception that they have created.
In the current case, we have an extremely stretched 4-year cycle in the equity markets. The decline into this overdone 4-year cycle low will serve to correct the entire advance up out of the 2002 low. At the same time, my Fed model told me back in June that we had once again entered into another rate cutting cycle. Again, just as in the cases before, these are two independent events. But, the spin from the propaganda machine is to make you think that by cutting rates the Fed has control. Fact is, rate cuts and the equity markets are two separate issues. Rising rates in the 1960's and 1990's did not prevent the equity markets from rising and lowering rates between 2000 and 2002 did not keep the equity markets from falling, nor did the rate cuts between 1929 and 1932.
On another note, others talk about the Plunge Protection Team (PPT), which allegedly comes into the market and buys futures to “control” the market. This is something that I can't prove or disprove. Therefore, to form an opinion about any manipulative efforts of this degree would not be based on fact. Furthermore, I will argue that if it does exist, it will not matter in the long run as all manipulative efforts ultimately do fail.
The following text on Manipulation was taken from Robert Rhea's book, The Dow Theory .
“Manipulation is possible in the day to day movement of the averages, and secondary reactions are subject to such an influence to a more limited degree, but, the primary trend can never be manipulated.
Hamilton frequently discussed the subject of stock market manipulation. There are many who will disagree with his belief that manipulation is a negligible factor in primary movements, but it should always be remembered that he had, as a background for his opinions, a most intimate acquaintance with the veterans of Wall Street, and the advantage of having spent his life in accumulating facts pertaining to financial matters.
The following comment, taken at random from his many editorials, affords convincing proof that his views on the subject of manipulation did not vary:
‘A limited number of stocks may be manipulated at one time, and may give an entirely false view of the situation. It is impossible, however, to manipulate the whole list so that the average price of 20 active stocks will show changes sufficiently important to draw market deductions from them.' (Nov. 29, 1908)
‘Anybody will admit that while manipulation is possible in the day-to-day market movement, and the short swing is subject to such an influence in a more limited degree, the great market movement must be beyond the manipulation of the combined financial interests of the world.' (Feb.26, 1909)
‘…the market itself is bigger than all the ‘pools' and ‘insiders' put together.' (May 8, 1922)
‘One of the greatest of misconceptions, that which has militated most against the usefulness of the stock market barometer, is the belief that manipulation can falsify stock market movements otherwise authoritative and instructive. The writer claims no more authority than may come from twenty-two years of stark intimacy with Wall Street, preceded by practical acquaintance with the London Stock Exchange, the Paris Bourse and even that wildly speculative market in gold shares, ‘Between the Chains,' in Johannesburg in 1895. But in all that experience, for what it may be worth, it is impossible to recall a single instance of a major market movement which depended for its impetus, or even for its genesis, upon manipulation. These discussions have been made in vain if they have failed to show that all the primary bull markets and every primary bear market have been vindicated, in the course of their development and before their close, by the facts of general business, however much over-speculations or over-liquidation may have tended to excess, as they always do, in the last stage of the primary swing.' (The Stock Market Barometer) ‘…no power, not the U. S. Treasury and the Federal Reserve System combined, could usefully manipulate forty active stocks or deflect their record to any but a negligible extent.' (April 27, 1923)
‘The average amateur trader believes the stock market is guided in its trends by a certain mysterious ‘power,' this belief being the one factor, next to impatience, most responsible for his losses. He reads tipster sheets avidly; he scans the newspapers industriously for news likely, in his opinion, to change the trend of the market. He does not seem to realize that by the time the news of real importance is printed, its effect, so far as the basic trend of the market is concerned, has long ago been discounted.'
‘It is true that a flurry in the price of wheat or cotton may influence the day to day movement of stock prices. Moreover, sometimes newspaper headlines contain news which is construed as bullish or bearish by market dabblers, who collectively rush in to buy or sell, thus influencing or ‘manipulating' the market for a short period. The professional speculator is always ready to help the movement along by ‘placing his line' while the little fellow timidly ‘lays out' a few shares; then, when the little fellow decides to increase his commitments, the professional begins to unload and the reaction ends, and the primary movement is again resumed. It is doubtful if many of these reactions would ever be caused by newspaper headlines alone unless the market was either overbought or oversold at the time---the ‘technical situation' so dear to the hearts of financial news reporters.'
‘Those who believe the primary trend can be manipulated could, no doubt, study the subject for a few days and be convinced that such a thing is impossible. For instance, on September 1, 1929, the total market value of all stocks listed on the New York Stock Exchange was reported to have amounted to more than $89,000,000,000. Imagine the money which would have been involved in depressing such a mass of values even 10 per cent!'
All I can tell you is what I can prove in regard to interest rates and the reality of this situation is that the tool is the perception they have created. You have been warned!
I have begun doing free Friday market commentary that is available at www.cyclesman.com/Articles.htm so please begin joining me there. The November issue of Cycles News & Views has been released along with a very detailed slide show presentation on cycle quantification. In this slide show I give all of the details pertaining to the current set up surrounding the overdone 4-year cycle and what is expected to follow. Should you be interested in analysis that provides intermediate-term turn points utilizing the Cycle Turn Indicator, which has done a fabulous job, on stock market, the dollar, bonds, gold, silver, oil, gasoline, the XAU and more, those details are available in the newsletter and short-term updates. A subscription includes access to the monthly issues of Cycles News & Views covering the Dow theory, and very detailed statistical based analysis plus updates 3 times a week.
By Tim Wood
Cyclesman.com
© 2007 Cycles News & Views; All Rights Reserved
Tim Wood specialises in Dow Theory and Cycles Analysis - Should you be interested in analysis that provides intermediate-term turn points utilizing the Cycle Turn Indicator as well as coverage on the Dow theory, other price quantification methods and all the statistical data surrounding the 4-year cycle, then please visit www.cyclesman.com for more details. A subscription includes access to the monthly issues of Cycles News & Views covering the stock market, the dollar, bonds and gold. I also cover other areas of interest at important turn points such as gasoline, oil, silver, the XAU and recently I have even covered corn. I also provide updates 3 times a week plus additional weekend updates on the Cycle Turn Indicator on most all areas of concern. I also give specific expectations for turn points of the short, intermediate and longer-term cycles based on historical quantification.
Tim Wood Archive |
© 2005-2022 http://www.MarketOracle.co.uk - The Market Oracle is a FREE Daily Financial Markets Analysis & Forecasting online publication.


