


Weekly Gold Silver and Uranium Technical Analysis Report - Gold Bull Unstoppable
Commodities / Gold & Silver Nov 04, 2007 - 12:31 AM GMTBy: Merv_Burak

 Despite all the short selling, gold seems to be unstoppable. Where and when will all this end? Your guess is as good as mine.
GOLD : LONG TERM
For the past almost three months gold has been on a tear. How long it will last before a significant rest period, or even a reaction, sets in is anyone's guess. This chart (or at least a very similar one) was shown with my commentary of 07 Sept 2007 . We have just breached the first of the long term projections based upon this past year and a half consolidation period. That one was at $780. We are now heading towards the next one at $915 with $1035 beyond that. Projections can be made whenever the action goes through a lateral consolidation period.
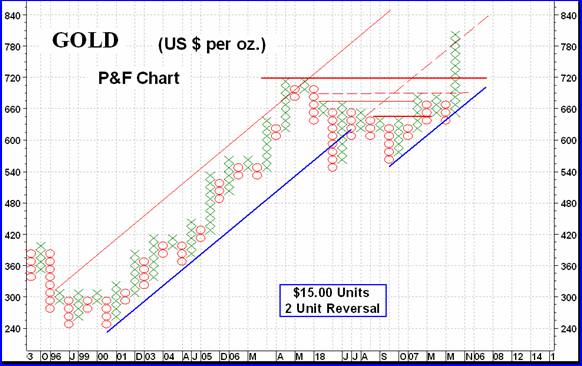
Then as it breaks significant resistance levels we can calculate a projection. Do they work? Well they seem to. In my experience the initial projection, whether in stocks, bullion or Indices, is the most likely to come true, in fact over 80% of the time. Then the more new projections the less likely they are to be fulfilled until at some point the action reverses (it always does). So for now breadth easy but ALWAYS be on guard for surprises.
Looking at the usual long term indicators, everything is positive with a couple of cautions. Checking the momentum strength versus the strength during the March-May 2006 move I see that although the momentum started with the same strength level, in the past month the strength has been deteriorating. Just a warning for now. Although the volume indicator has kept pace with the performance of the previous period I would have been more impressed if the upside volume was somewhat more aggressive. However, I must still rate the long term as BULLISH .
INTERMEDIATE TERM
The intermediate term continues to look good with all the indicators on the positive side. The weakening in the momentum indicator is even more pronounced here than in the long term. For the past month and a half, as the price of gold continued to move higher and higher, the momentum indicator has turned from an initial aggressive up trend into a lateral trend. Now this suggests a weakening in the underlying rate of strength increase in the price move and is not yet disastrous. It is when the momentum indicator starts to show a rate of strength as a negative as the price moves higher that one has to really watch out for. Then, of course, as the momentum drops below its neutral line one starts to make darn sure he has his exit strategy up to date. But that's still off in the distant future. For now the intermediate term is also rated as BULLISH .
SHORT TERM
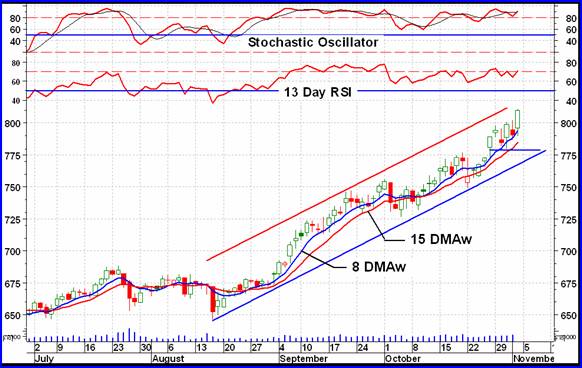
The short term move just seems to go on and on. At some point it will come to an end but at this writing that end is not yet here. There are indications of concern but that's about it. The short term momentum indicator (13 Day RSI) has been tracing a lateral path as the up trend in price reaches new heights. Not yet a serious concern but a warning anyway. We can draw an up trending channel that traps the action throughout the advance so once the price drops down below the lower line we should be out, short term wise. An earlier sign might be if the short term moving average line should turn downwards first but most likely the two will occur at about the same time. In the mean time all is still well and the short term is still rated as BULLISH .
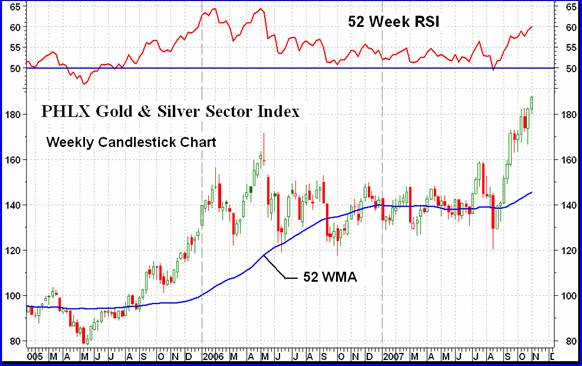
NORTH AMERICAN GOLD INDICES
Well, we're back to the most popular gold Index, the PHLX Gold & Silver Sector Index ( XAU ). As the chart shows, the Index is now at new highs as are all the other majors except the S&P/TSX Global Gold Index shown last week. The poorer performance of that Index may be mostly due to the stronger CDN $. Since Feb the CDN $ has gained 27% versus the US $, which would more than make up for the difference in Index performance.
There is nothing that critical in the PHLX chart. The moving average has finally perked up and is heading higher, the momentum continues in the positive zone and the Index is into new highs. All is well with the world – so far.
MERV'S PRECIOUS METALS INDICES
Everything is bubbling along so well that I'll forgo the normal commentary and just clue you in on what has (had) been happening to the Indices. The Indices are finally upgraded and subscribers have the latest upgraded components in the Indices Tables.
Merv's Qual-Gold Index
This Index includes 30 of the largest gold and silver stocks traded on the North American exchanges based upon their market value at the time of upgrade. There was next to no change except for stocks delisted due to take-overs and such.
Merv's Spec-Gold Index
This Index includes the next 30 largest stocks traded on the North American exchanges based upon market value at the time of upgrade. They may be looked at as the second tier stocks. There might be some stocks missing in this section that belong here. This is due to two things. First, I can only include stocks that have an active trading history of at least one year due to the programming of the tables. The other reason is that I might have just missed some stocks. Should there be any stocks that belong in this list (or the Qual list) Please let me know. That would be appreciated.
There were several changes to the component list during this upgrade, most just because of market value changes.
Merv's Gamb-Gold Index
This Index includes 30 stocks of a speculative or gambling variety. Over the past many months I may not have been monitoring this file as closely as I should have been. This group has undergone almost a total change. It now represents the real gambling variety of stocks. Almost all are in early stages of what might be major moves. If I had updated this group a couple of weeks ago as I had started, the Index would be anywhere from 10 to 20% higher than it is now. The lower performance of this Index this week is due to the super performance these stocks have gone through over the past few weeks and it was time for a rest. Many (or most) of these stocks will move again after a breather. Some WILL NOT. That is the gamble here.
Merv's Gold & Silver 100 Index
Although not published, this Index includes the top 100 gold and silver stocks traded on North American exchanges, based upon market value at time of upgrade. As with the Spec-Gold Index, there may be stocks that were missed but should be included here. The Index had gone through a significant revision with many new stocks and many upgraded due to market value changes.
Merv's Gold & Silver 160 Index
All the stocks in the other Merv's Indices are included here in this universe of 160. In addition, many stocks that just lost out from being included into the 100 list are here for future inclusion. Additional gambling variety stocks that could not make it into the Gamb Index are also included here. There has been a major revision to the universe components. About 30 or 40 stocks have been replaced during this upgrade.
Merv's Qual-Silver Index
There was no change to the 10 component stocks in this Index. These are the 10 largest stocks within the silver mining industry.
Merv's Spec-Silver Index
There were a few changes to the 25 component stocks in this Index. The Index may be considered as an in-between Index in quality, in-between speculative and gambling with both components represented.
Back to the normal Indices review next week.
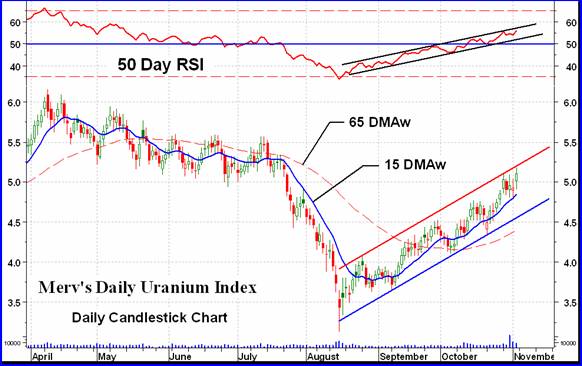
Merv's Uranium Index
With the launch of my blog Technically Uranium with Merv at www.techuranium.blogspot.com I provide daily uranium commentary and stock analysis along with a week-end update. I am going to try something extra with these commentaries, at least for a while to see how it goes. I will try and include a Friday “after the close” commentary here for my precious metals readers. For daily commentaries during the week and for the week-end wrap-up please check out the blog. Let me know what you think and any suggestions would be appreciated.
The Merv's Daily Uranium Index closed Friday on a very good note. It was up 0.180 points or 3.65%. Of the 50 Index component stocks there were 29 winners on Friday, 15 losers and 6 going nowhere. Of the five largest stocks by market value, Cameco closed higher by 3.4%, Denison closed lower by 3.1%, Paladin closed lower by 1.3%, UEX closed higher by 5.3% and Uranium One closed higher by 1.9%. The best daily performer was Energy Fuels with a daily gain of 21.8% while the worst daily performer was Max Resources with a loss of 9.7%.
As the chart shows, the uranium stocks, in general, are having a good and glorious time of it. They are well above their intermediate term moving average line with a momentum indicator that continues higher inside its positive zone. The only cautionary indicator is the volume indicator (not shown). Ever since April it has traced a lateral path except for a couple week plunge during the Aug fiasco. It would be great if the volume picked up on up trading days. Lastly, the Index and momentum indicator have been trapped inside up trending channels for over two and a half months now. As long as they remain inside their channels, or break above, there is no worry from the intermediate term. I can only rate the intermediate term for uranium stocks as BULLISH .
Merv's Precious Metals Indices Table
Well, that's it for this week.
By Merv Burak, CMT
Hudson Aero/Systems Inc.
Technical Information Group
for Merv's Precious Metals Central
Web: www.themarkettraders.com
e-mail: merv@themarkettraders.com
For DAILY Uranium stock commentary and WEEKLY Uranium market update check out my new Technically Uranium with Merv blog at www.techuranium.blogspot.com .
During the day Merv practices his engineering profession as a Consulting Aerospace Engineer. Once the sun goes down and night descends upon the earth Merv dons his other hat as a Chartered Market Technician ( CMT ) and tries to decipher what's going on in the securities markets. As an underground surveyor in the gold mines of Canada 's Northwest Territories in his youth, Merv has a soft spot for the gold industry and has developed several Gold Indices reflecting different aspects of the industry. As a basically lazy individual Merv's driving focus is to KEEP IT SIMPLE .
To find out more about Merv's various Gold Indices and component stocks, please visit www.themarkettraders.com and click on Merv's Precious Metals Central . There you will find samples of the Indices and their component stocks plus other publications of interest to gold investors. While at the themarkettraders.com web site please take the time to check out the Energy Central site and the various Merv's Energy Tables for the most comprehensive survey of energy stocks on the internet. Before you invest, Always check your market timing with a Qualified Professional Market Technician
Merv Burak Archive |
© 2005-2022 http://www.MarketOracle.co.uk - The Market Oracle is a FREE Daily Financial Markets Analysis & Forecasting online publication.