Resistance Plateau for Crude Oil
Commodities / Crude Oil Mar 03, 2011 - 03:00 PM GMTBy: Mike_Paulenoff
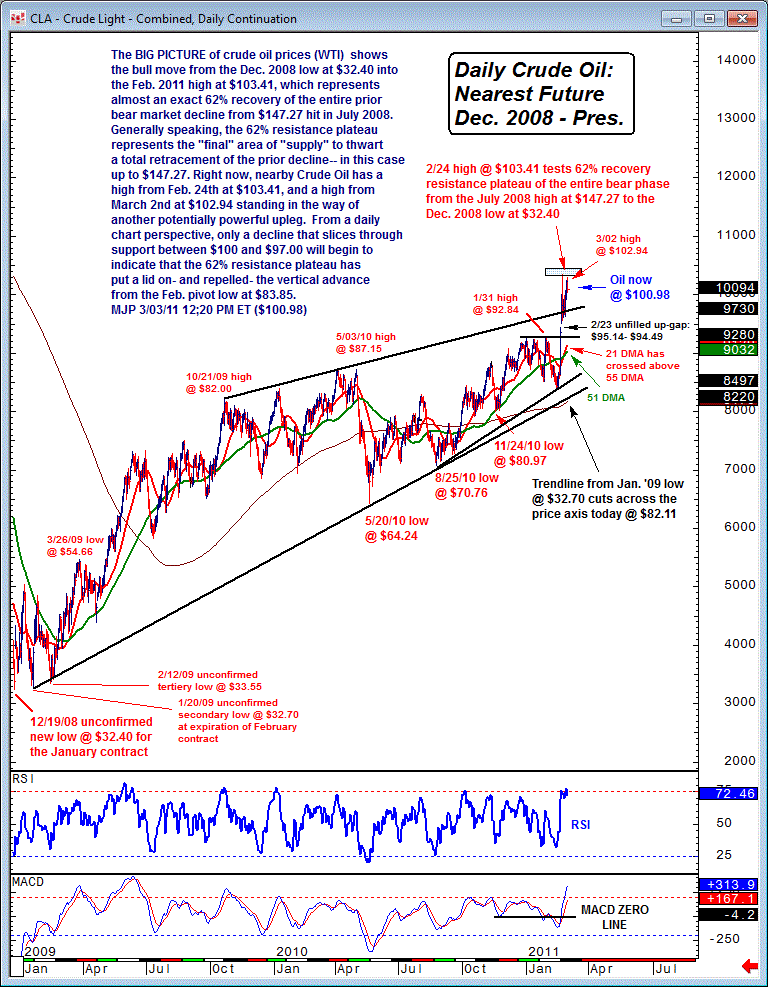
While crude oil waffles around between $103 and $100, let's take a look at the big picture. The big picture of crude oil prices (WTI futures) shows the bull move from the Dec 2008 low at $32.40 into the Feb 2011 high at $103.41, which represents almost an exact 62% recovery of the entire prior bear market decline from $147.27 hit in July 2008.
Generally speaking, the 62% resistance plateau represents the "final" area of "supply" to thwart a total retracement of the prior decline -- in this case up to $147.27. Right now, nearby crude oil has a high from Feb 24 at $103.41, and a high from Mar 2 at $102.94 standing in the way of another potentially powerful upleg.
From a daily chart perspective, only a decline that slices through support between $100 and $97.00 will begin to indicate that the 62% resistance plateau has put a lid on, and repelled, the vertical advance from the Feb pivot low at $83.85.

Sign up for a free 15-day trial to Mike's ETF & Stock Trading Diary today.
By Mike Paulenoff
Mike Paulenoff is author of MPTrader.com (www.mptrader.com), a real-time diary of his technical analysis and trading alerts on ETFs covering metals, energy, equity indices, currencies, Treasuries, and specific industries and international regions.
© 2002-2011 MPTrader.com, an AdviceTrade publication. All rights reserved. Any publication, distribution, retransmission or reproduction of information or data contained on this Web site without written consent from MPTrader is prohibited. See our disclaimer.
Mike Paulenoff Archive |
© 2005-2022 http://www.MarketOracle.co.uk - The Market Oracle is a FREE Daily Financial Markets Analysis & Forecasting online publication.


