


What's Going On With the SP500 Stocks Index Now
Stock-Markets / Stock Markets 2011 Mar 17, 2011 - 05:21 AM GMTBy: Richard_Shaw

 Not surprisingly, we have been getting lots of calls about the markets in light of both the unsettling circumstances in the Middle East and the triple catastrophe in Japan, with the still brewing European debt crisis in the background.
The first observation is that events, more than analysis, are driving the markets at this point. That puts macro-economic observation and thinking in first position, price chart behavior in second position, and fundamental analysis in third position in terms of what is most likely to occur in the markets in the short-term.
We have no way to gauge the degree of global business interuption that the Japanese situation will cause. The full extent of supply chain disruption based components that come from Japan has yet to be revealed. The situation in Bahrain could be explosive if it is in fact a proxy battle between Saudi Arabia and Iran. European Ministers are still really just talking about solving debt problems in the peripheral countries, and the European Central Banks is talking tough in the opposite direction of providing debt relief with possible interest rate increases. China is growing fast, but at a slower rate. Several governmental policy, geopolitical, geophysical or nuclear technological factors could switch investors on or off to risk in the short-term
We can't predict the unpredictable, although the popular phrase today is to expect the unexpected -- good trick if you can do it.
On the other hand, taking protective measures to reduce the impact of, or exposure to, risk is something else that we can do.
First, we think we are still in a primary market up trend, but we are in an events driven correction. Most of our clients would put capital preservation ahead of pursuit of gain in a difficult environment like this. For some it is close monitoring of end-of-day price declines versus highest attained prices since purchase -- that's our in-house StopAlerts system. For some it is intra-day, tick-by-tick automatic stop loss orders at the brokerage. And for others is it taking some money off the table.
For those wishing to lighten up market participation, we are in 1/3 to 1/2 cash positions -- splitting the baby, tending to keep the high quality dividend payors and the energy or utility companies, or flexible capital funds; while reducing Asian exposure and broad equity index allocation.
The two attached charts of SPY (the S&P 500 index ETF) may be of some interest. We borrowed one (the one with a picture of Buzz Lightyear in the upper left corner) from the analysts at StockCharts.com. The other we made ourselves.
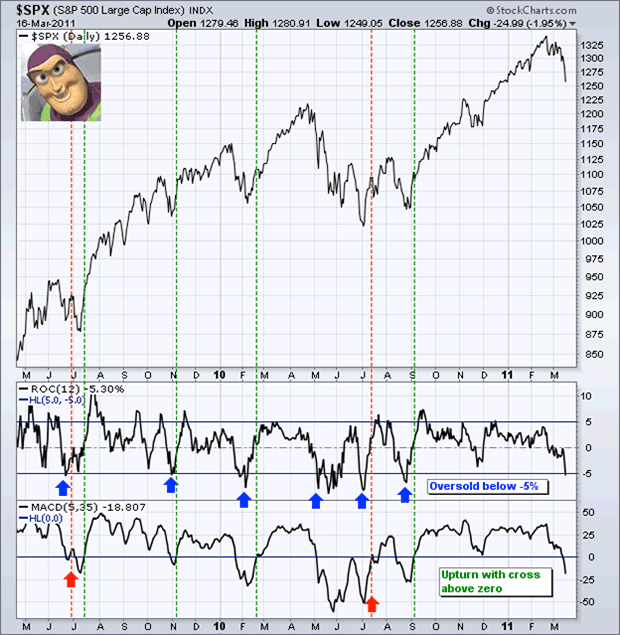
Basically they show a significant short-term break-down in the price pattern for SPY. The indicators plotted with the prices charts show stronger selling pressure than buying pressure (surprise, surprise) and approaching "oversold" conditions (which means the rate of decline is a bit too fast and is likely to create a least a short-term rally attempt).
The Buzz Lightyear chart plots the 12-day rate of change of price (labeled ROC) and shows that more than 5% in 12 days has tended over the past two years (during a primary up trend) to result in some form of rally soon after. It also shows an indicator called "MACD" that they say tends to confirm a rally when the value goes above zero --- it's still pointing down.
The other chart (our own work of art) shows the SPY over the past few months. The bottom panel plots the 200-day moving average shown in gold, and the 1-month (red) and 3-months (blue) high and low prices, with the mid-points of those ranges in dashed lines. It shows the price to be creating new lows for 1-month and to be below the mid-point of the 3-month range. That's not good, and it's characteristic of something more serious than simple price fluctuation.
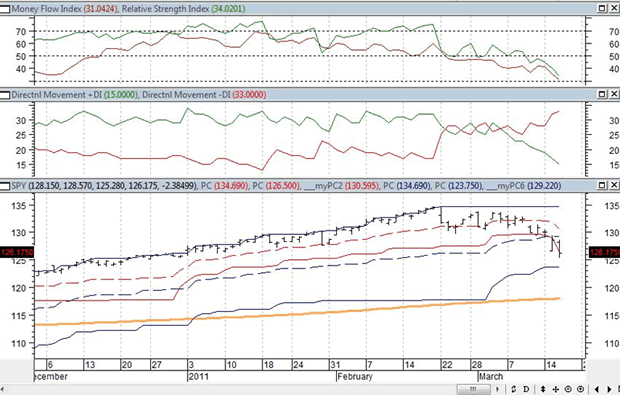
The middle panel plots two indicators that represent buying pressure (in green) and selling pressure (in red). We can talk individually about how these indicators are constructed if you wish, but for the moment accept that they measure pressure up and pressure down. The red downward pressure is greater than the green upward pressure, and the downward pressure is increasing while the upward pressure is decreasing. That's not good either.
The top panel plots something called relative strength (RSI) in green, and money flow in red. RSI is calculated only with price changes, while money flow also works with volume factors. We can talk about those too, but if you will go with the flow here, they show the direction of pressure or directional tendency, and also what are called indicators of "oversold" and "overbought" conditions (conditions that beg for near-term relief with some counter-direction movement). They are both approaching an oversold condition. So they agree with the Buzz Lightyear chart about the rubber band stretched pretty tight to the downside for the moment, with some snap back potential, at least for a bit.
All of that sort of analysis is based on a somewhat normal world, and there ain't too much normal going on right now, so events could entirely overtake the charts in either direction. The charts, however, which are nothing more than the signature of the aggregate opinions and emotions of investors, point to more pain before gain.
Happy to speak with you about these and other matters.
Disclaimer: This article is not personal investment advise to any specific person for any particular purpose. This article is presented subject to the full disclaimer found on our site available here.
By Richard Shaw
http://www.qvmgroup.com
Richard Shaw leads the QVM team as President of QVM Group. Richard has extensive investment industry experience including serving on the board of directors of two large investment management companies, including Aberdeen Asset Management (listed London Stock Exchange) and as a charter investor and director of Lending Tree ( download short professional profile ). He provides portfolio design and management services to individual and corporate clients. He also edits the QVM investment blog. His writings are generally republished by SeekingAlpha and Reuters and are linked to sites such as Kiplinger and Yahoo Finance and other sites. He is a 1970 graduate of Dartmouth College.
Copyright 2006-2011 by QVM Group LLC All rights reserved.
Disclaimer: The above is a matter of opinion and is not intended as investment advice. Information and analysis above are derived from sources and utilizing methods believed reliable, but we cannot accept responsibility for any trading losses you may incur as a result of this analysis. Do your own due diligence.
Richard Shaw Archive |
© 2005-2022 http://www.MarketOracle.co.uk - The Market Oracle is a FREE Daily Financial Markets Analysis & Forecasting online publication.