U.S. Dollar Breakdown or Reversal?
Currencies / US Dollar Mar 21, 2011 - 07:09 AM GMTBy: John_Hampson
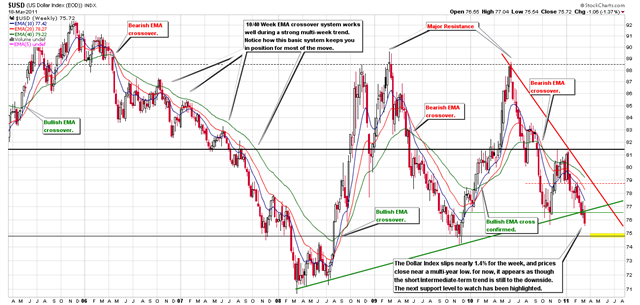
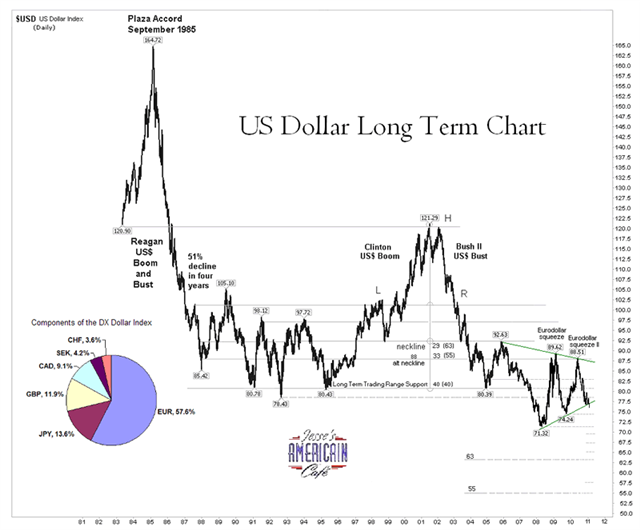
 The US Dollar has now broken beneath long term rising support, as shown in the first chart below of the US Dollar index. There are other support levels below, around 75 and then 72, but beneath that we would enter unchartered territory, as shown in the second longer term chart, and the weakness of the latest dollar bounce is notable.
Source: Portfolio Tilt
Source: Jesse's Americain Cafe
However, the level of current short contracts in the US Dollar and the mere 5% US Dollar bulls as measured by the Daily Sentiment Index have usually historically implied an imminent reversal, as these can be contrarian indicators. So is the US dollar likely to break down here or reverse and make a sustained bounce?
First understand what makes up the US dollar index. It is the US dollar relative to a basket of currencies, with weightings 58% Euro, 14% Yen, 12% Sterling, 9% Canadian Dollar, 4% Swedish Krona and 4% Swiss Franc. Therefore, the key currency pair is Euro-USD. At the last ECB meeting on the 3rd March the European Central Bank surprised the market by deploying language interpreted to mean a rate rise is coming, most likely at the next meeting on 7th April. The Euro has therefore since rallied against multiple currencies, including the US Dollar. However since that meeting the Japan disaster has happened, which will hamper global growth. Given that, will the ECB postpone its rise? If it does, we could see a reversal of fortunes for Euro-USD, but not likely until 7th April.
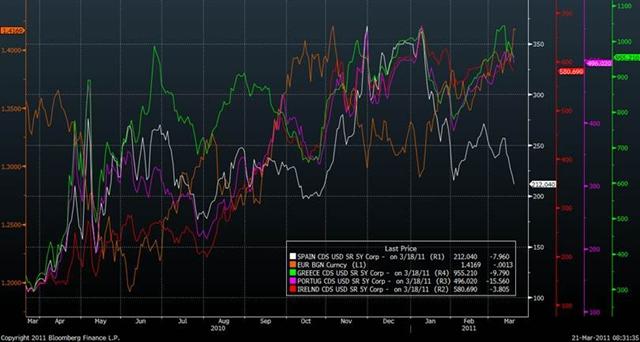
European debt issues are still with us, but have not recently been front page news with developments in the Middle East, North Africa and Japan dominating. The CDS chart below shows that the costs of insuring Greek, Portugese and Irish debt are still rising, and suggesting that Portugal may be next in line for a bailout. However, worries over Spain (white line) have receded and this may well have been critical to the Euro's recent strength. For whilst a Portugese bailout would not be good news, the size of its economy is nowhere near Spain's, and the key fears over the Euro region centered on whether a big player, likely Spain, would hit the wall. With a summit meeting this week that should deliver a larger and improved rescue facility for Euro members requiring aid, short term or longer, confidence in the Euro may be set to improve in a sustained way.
Source: IBTimes.com
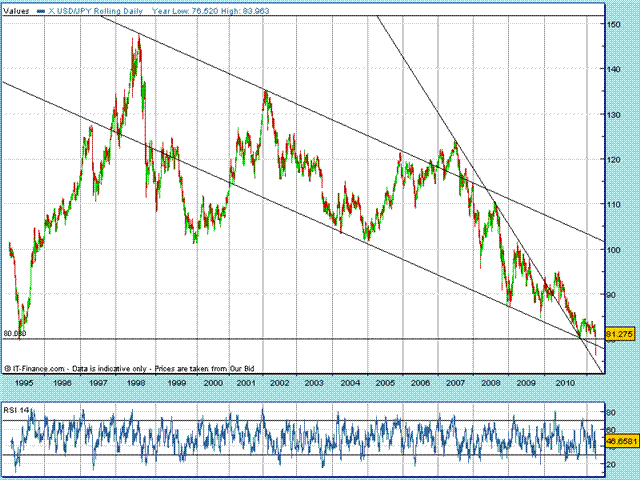
The second most important currency pair in the US Dollar index is USD-Yen. Below is the long term chart and what happened shortly after the Japan disaster was a breakdown beneath two key long term supports as the Yen strengthened. However, Central Banks then intervened together last week to bring down the Yen to assist Japan, resulting in a V-bounce and the contract at the time of writing back above 81 and the clear of the two supports. This chart formation coupled with oversold indicator readings is technically suggestive of a fake-out and important low. A reversal in this contract would have supportive implications for the US Dollar index, but it may require sustained Central Bank invervention on the Yen to maintain momentum.
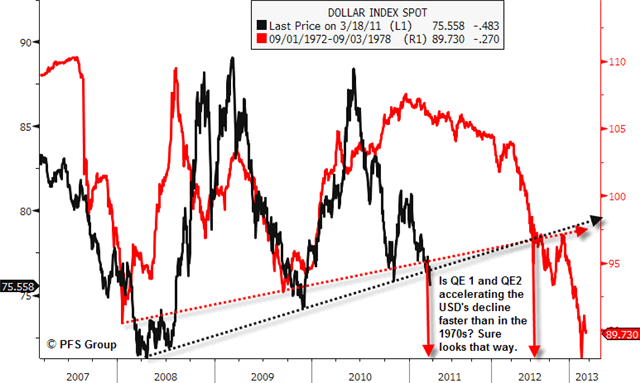
So what about the dollar's own current fundamentals? Ongoing programmes of Quantitative Easing have served to devalue the currency and Chris Puplava questions whether these programmes have accelerated the currency's decline compared to the historical rhyme of the 1970s.
Source: Chris Puplava
But with QE currently scheduled to end in June, is the US Dollar likely to garner support as we approach mid-year? Well, much would depend on whether QE does indeed end or whether it is extended in some form. Is the Fed prepared to let the stimulus lapse with two key areas of the economy still significantly dragging - jobs and real estate - together with Japan's global drag? Fed wording suggests they may be reluctant. And who would step in to fill the major gap in Treasury demand? Yields cannot be allowed to rise too far. Therefore, some kind of continued intervention beyond June looks likely, but how explicit this is remains to be seen.
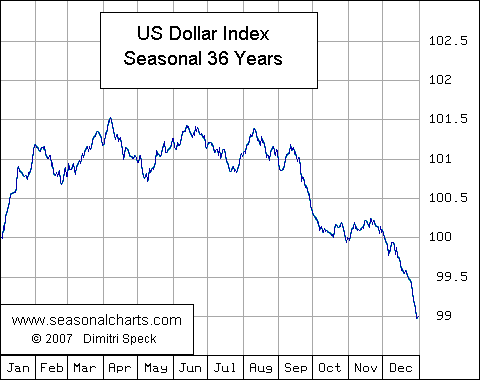
Lastly, a look at seasonality and cycles. The US Dollar's poor seasonal chart reflects its long term demise, but the worst performance has typically been September to December, which correlates inversely with a seasonally strong time for precious metals.
Source: Seasonalcharts.com
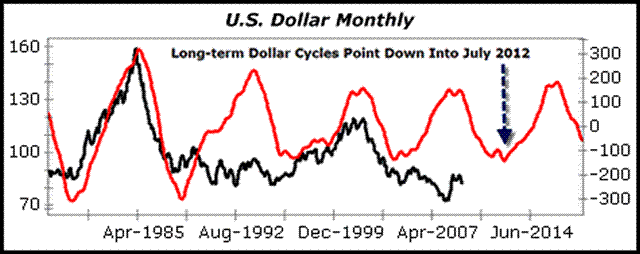
In terms of cycles, the US Dollar would be expected to track down to a major low around mid-2012.
Source: Moneyandmarkets.com
I have forecast precious metals to make a secular parabolic peak in the period 2011-2014 (see my article: End Of The Secular Commodities Bull Market?), and whilst a Dollar breakdown is not essential to achieve that, the historical inverse relationship suggests it is likely. A seasonal decline for the USD into the end of 2011 and a continuation into an important cyclical low in mid 2012 would provide a suitable backdrop to a powerful final upleg for precious metals.
In summary, the technical picture for the US Dollar is weak, having broken long term rising support, and having broken quicker than in the 1970s historical rhyme, with QE likely providing the acceleration. However, contrarian levels of USD sentiment means a sustained bounce is possible, and supportive of this possibility are action in USD-Yen and the ECB potentially postponing a rate rise due to the Japan disaster impact on growth. Therefore, in the short term I have no positions in the US dollar and want to closely observe whether the US Dollar index garners support at the next support level of 75 and how the USD-Yen chart action plays out.
Medium to longer term, several key factors make it likely the US Dollar will decline further and take out its historic low: the likelihood of extending QE in some explicit or less explicit way in the US after June, the likelihood of the ECB raising rates ahead of the US even if not immediately, strengthening confidence in the Euro region's debt and aid, and the likely steep upward conclusion to the secular precious metals bull with its inverse relationship to the USD.
John Hampson
John Hampson, UK / Self-taught full-time trading at the global macro level / Future Studies
www.amalgamator.co.uk / Forecasting By Amalgamation.
© 2011 Copyright John Hampson - All Rights Reserved
Disclaimer: The above is a matter of opinion provided for general information purposes only and is not intended as investment advice. Information and analysis above are derived from sources and utilising methods believed to be reliable, but we cannot accept responsibility for any losses you may incur as a result of this analysis. Individuals should consult with their personal financial advisors.
© 2005-2022 http://www.MarketOracle.co.uk - The Market Oracle is a FREE Daily Financial Markets Analysis & Forecasting online publication.


