


U.S. Jobs, Housing, and Petroleum Usage Illustrates Stimulus Fed Led Financial Recovery
Economics / Economic Recovery Mar 23, 2011 - 11:08 AM GMTBy: Mike_Shedlock

 If the recovery was in full swing, why isn't petroleum usage?
Here are a pair of charts from reader Tim Wallace showing the percentage change in petroleum usage over time.
Except for January of 2008, the peak months for petroleum usage were all during 2007. The first chart below shows first quarter usage 2008-2011 as compared to the same month in 2007.
Q1 Petroleum Distillates Usage 2008-2011 vs. 2007
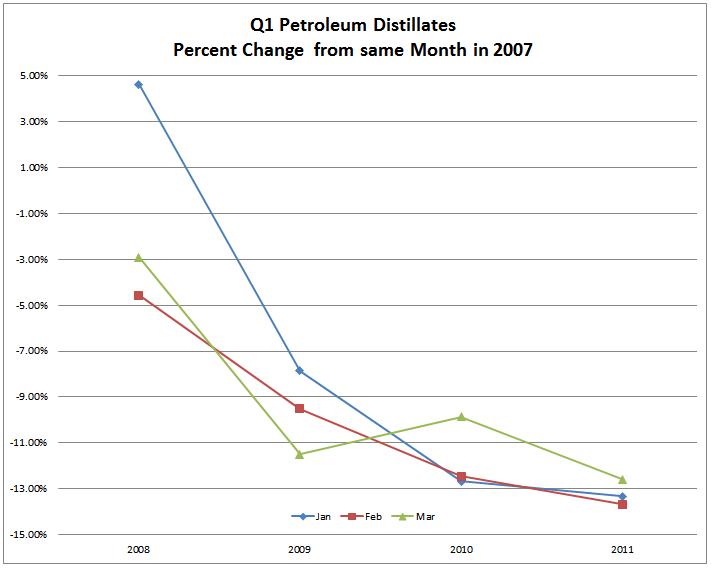
Except for January of 2008 and a brief bounce in March of 2010, petroleum usage has been in a steady decline since the recession started.
Historical Petroleum Growth
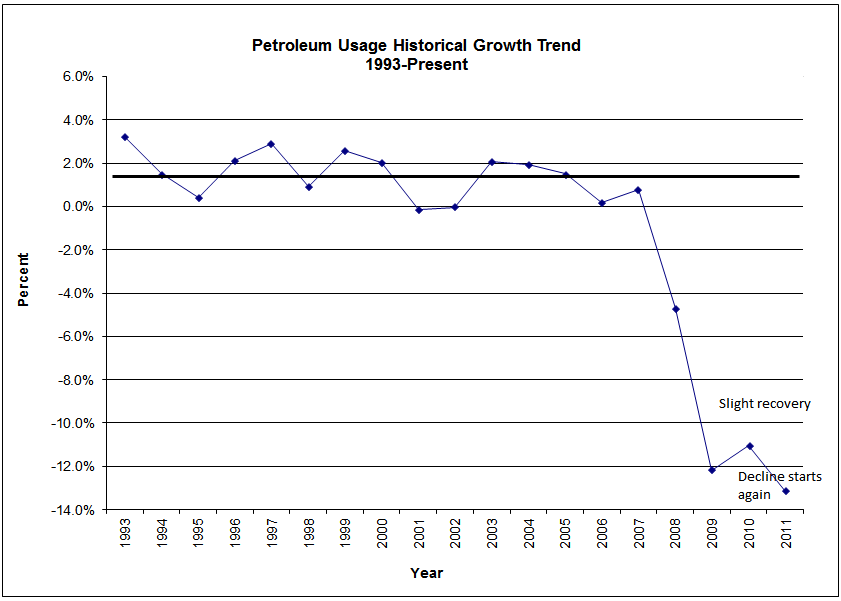
The historical growth chart above helps put the first chart in proper perspective. Annual declines in petroleum usage have never occurred before. Now they persist for 3 years running in spite of an alleged "recovery" that started two years ago.
There is also no recovery in jobs, new home sales, or consumer credit.
New Home Sales
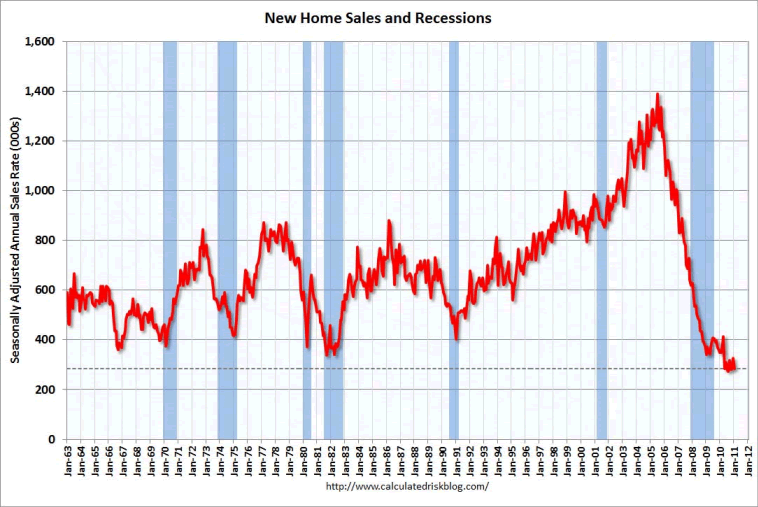
The above chart courtesy of Calculated Risk.
Change in Total Consumer Credit Outstanding

The above chart shows change in consumer credit in billion of dollars from a year ago.
Nonfarm Payroll Employment - Seasonally Adjusted Total
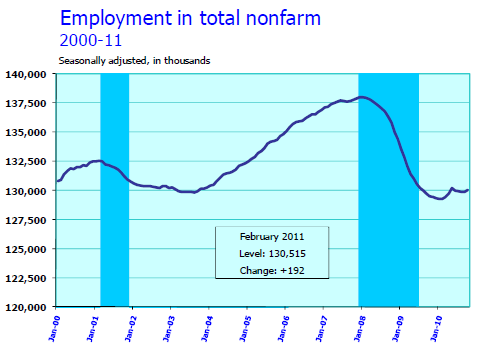
According to the BLS, non-farm employment is lower than it was 11 years ago!
The BLS says the unemployment rate dropped the past year. I find that questionable given that it takes roughly 125,000 new jobs a month on average just to hold the unemployment rate steady.
Gallup, also pegs the unemployment rate much higher. Please see Gallup Poll Pegs Unemployment Rate at 10.2%, Underemployment at 19.9%, Same as Last Year for details.
Petroleum usage together with housing, jobs, and consumer credit paints a much different picture about the "recovery" than cheerleaders would have you believe.
Yes there has been a recovery in manufacturing, but one bright spot in a sea of weakness does not a recovery make. Moreover, it's important to note that auto sales are substantially off their peak years.
Finally, please consider Shrinking Labor Pool Means Shrinking Demand For Housing for additional charts by Tim Wallace on home sales vs. changes in the U.S. labor pool.
All things considered, but especially jobs, housing, and petroleum usage, there is solid evidence we are in the midst of a stimulus-fed financial-recovery as opposed to a recovery in any real sense of the word.
When the stimulus dies, the recovery will die with it.
By Mike "Mish" Shedlock
http://globaleconomicanalysis.blogspot.com Click Here To Scroll Thru My Recent Post List
Mike Shedlock / Mish is a registered investment advisor representative for SitkaPacific Capital Management . Sitka Pacific is an asset management firm whose goal is strong performance and low volatility, regardless of market direction.
Visit Sitka Pacific's Account Management Page to learn more about wealth management and capital preservation strategies of Sitka Pacific.
I do weekly podcasts every Thursday on HoweStreet and a brief 7 minute segment on Saturday on CKNW AM 980 in Vancouver.
When not writing about stocks or the economy I spends a great deal of time on photography and in the garden. I have over 80 magazine and book cover credits. Some of my Wisconsin and gardening images can be seen at MichaelShedlock.com .
© 2011 Mike Shedlock, All Rights Reserved.
© 2005-2022 http://www.MarketOracle.co.uk - The Market Oracle is a FREE Daily Financial Markets Analysis & Forecasting online publication.