


Stock Market Pullback Before Going Higher Likely
Stock-Markets / Stock Markets 2011 Apr 04, 2011 - 03:05 AM GMTBy: Andre_Gratian

 Current Position of the Market
Very Long-term trend - The continuing strength in the indices is causing me to question whether we are in a secular bear market or two consecutive cyclical bull/bear cycles. In any case, the very-long-term cycles are down and, if they make their lows when expected, there will be another steep and prolonged decline into 2014-15.
Long-term trend - In March 2009, the SPX began an upward move in the form of a bull market. Cycles and P&F projections point to a continuation of this trend for several more months.
SPX: Intermediate trend - The intermediate trend is still up and does not look in immediate danger of reversing. A short-term correction appears to be complete, but there could be a pull-back before moving higher.
Analysis of the short-term trend is done on a daily basis with the help of hourly charts. It is an important adjunct to the analysis of daily and weekly charts which discusses the course of longer market trends.
Market Overview
A Point & Figure chart is the simplest way to keep track of stocks and indices. The technique is over 100 years old, and one of its most valuable attributes is its ability to project prices. Once one has mastered it, a lot (but not all) of the uncertainty and guess work has been eliminated from technical analysis.
Let's apply it to today's market to see where we are and where we could be going. Because I still don't have access to the complete data needed to establish valid counts of the 2009 base, I'll start by analyzing the accumulation which occurred during the 2010 intermediate correction of the SPX. The entire count for this base gives me a projection to 14xx already established from a lower level level. Now, let's see what we can derive from the recent re-accumulation pattern.
On the 1X1 chart that I now keep by hand, I can take valid counts from four different levels to determine where the SPX is likely to go before making a significant reversal. The first and most conservative one, taken across the 1258 level, has a projection to 1334. Others, taken from 1268, 1278, and 1286, yield higher projections, with the last one closely matching the 14xx target mentioned above. These price targets will be made available to subscribers in daily updates.
Based on the interpretation of a P&F chart, each separate count should represent the completion of a market phase and be followed by a correction, with the final count ostensibly marking the end of the intermediate trend which started at 1041. If higher counts can be derived from the 2009 base, 14xx will not be the end of the bull market.
The above gives the trader/investor a basic framework for future market moves which should be substantiated by other modes of technical analysis. Let's begin this process by looking at some charts.
Chart Analysis
We'll start with SPX Daily Chart. The index found its correction low of 1249.05 on 3/16, and has been rising ever since. On Friday, it reached our first projection of 1334 and even went a little farther to 1337.85. If our interpretation of the theory is correct, we should now get a reversal and start a consolidation before moving on to the next projection ***. Does the bar chart below warn us that we have reached a short-term top? Not really. The indicators both made new highs on Friday, and SPX has not broken its short-term uptrend line. There is a slight deceleration in the indicators, but it would be wishful thinking to say, on this basis alone, that we are ready to pause in the uptrend.
*** For reasons that I won't go into, it is possible that the SPX could extend its move to 1342-44 before starting its correction.
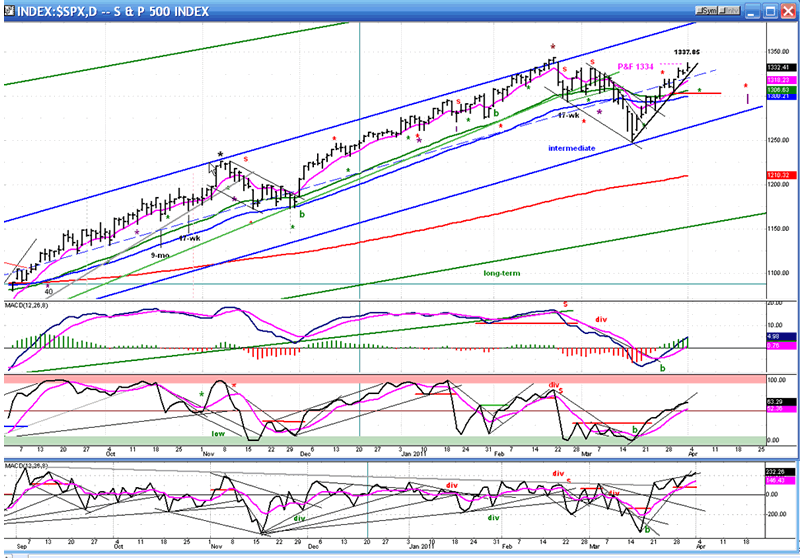
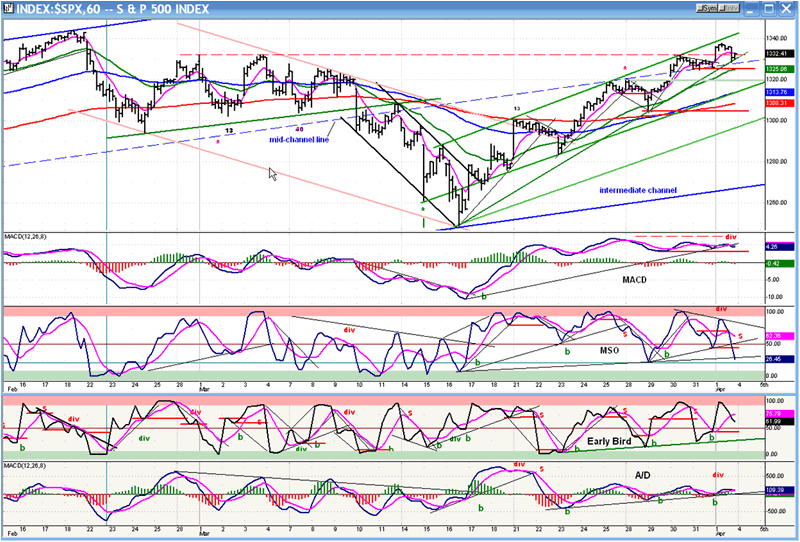
The Hourly Chart, however, is more explicit. The green channel (previously red) encompasses the short-term trend from 1249. The index has been hugging the top trend line -- a sign of strength. The low of the channel is currently about 1300. If we are going to have a correction, that would be a good target for its low. P&F projections can also be used for predicting short-term moves. However, since the top may not be "in", we will have to wait until it has been completed to deduce a count for the correction. That we were about to start one was ambiguous on the daily chart, but it is much clearer on this chart. Look at the indicators! The negative divergence in most of them was telling you to expect a pull-back. On Friday, they started to scream a little louder by beginning to roll over, with the two middle ones already in well-established downtrends.
In spite of that, all we have is a warning, and not a confirmed sell signal. In order to get one, several things will have to happen: the trend line connecting the lows will have to be broken and so will the 1325 level, the A/D will have to go decisively negative and the top and bottom indicators will have to start a downtrend.
Cycles and Projections
There is a minor cycle which is due on 4/7 which could mark the low of the correction. More reliable information will come by evaluating the amount of distribution in the topping pattern and establishing a projection target. Using Fibonacci should also be helpful. If we do not go beyond Friday's high, a .382 retracement would bring the SPX down to about 1303.
Sentiment
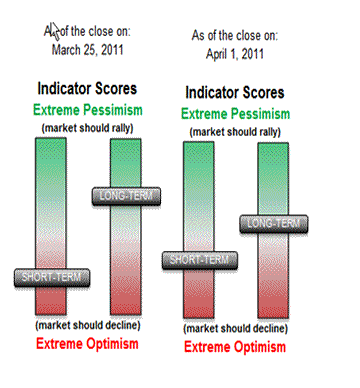
The SentimenTrader (courtesy of same) long-term indicator is no longer as bullish as it was a week ago, and the short-term indicator tells us to expect a near-term correction. Those readings are appropriate for the current market position.
In order to identify a significant top, the long-term indicator would probably have to drop down to the level of the short-term reading in the March 25 index.
Dollar index
Last week, I offered the following opinion: From the dollar P&F chart, I can deduce that 75.50 could turn out to be an important low, although touching 75.00 is also a possibility. Time will tell.
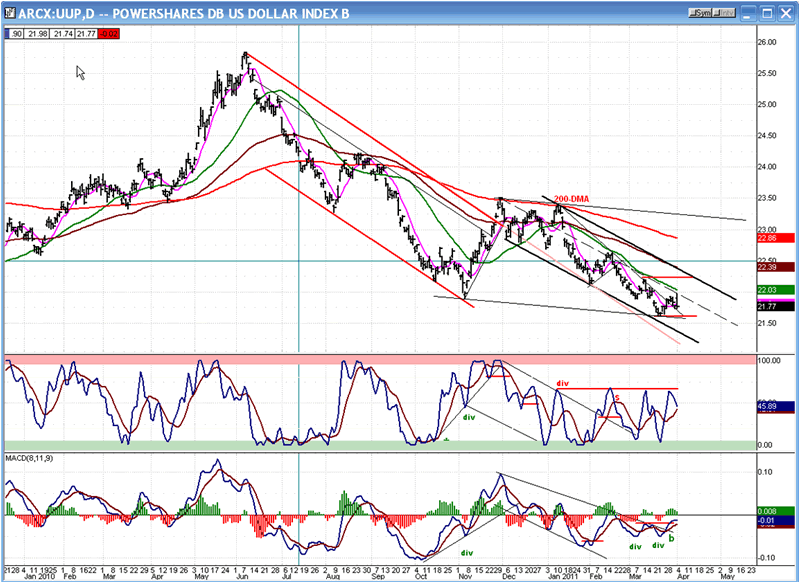
In fact, the dollar did bounce sharply after touching 75.43, motivated by the jobs report which sent it briefly to 76.61, but it could not hold that level and pulled back immediately. The base-building action may have begun.
The chart of the Dollar ETF (UUP, above) shows that an incipient uptrend may be underway. Both indicators have turned up from their lows, and the chart shows the kind of long-term deceleration which normally occurs just before a low. The last stage (black channel) has declined at a lesser angle than the section within the red channel. Friday's attempt at reversing was stopped at the mid-channel line. As soon as it goes through and the MACD turns positive, it will be ready to challenge the top of the channel and break out of its downtrend. When the UUP does establish an uptrend, it will probably pause at the 200-DMA once again.
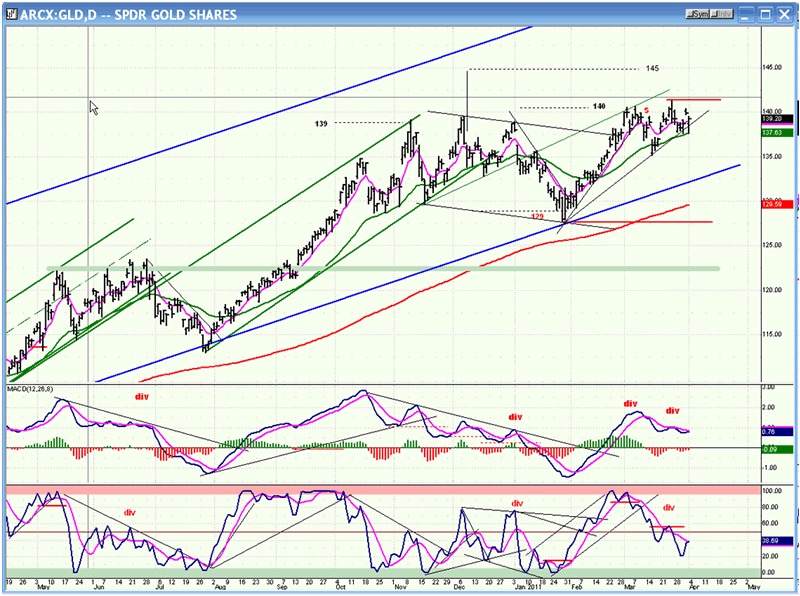
Gold
GLD already has three well-established points on its blue lower channel line. The next time it challenges it, it is likely to go through. Until then, there is a potential near-term projection to 145. If it should first drop below 135, that projection will most likely no longer be valid. A decline from the current level could see the index back around 129, or slightly lower.
OIL
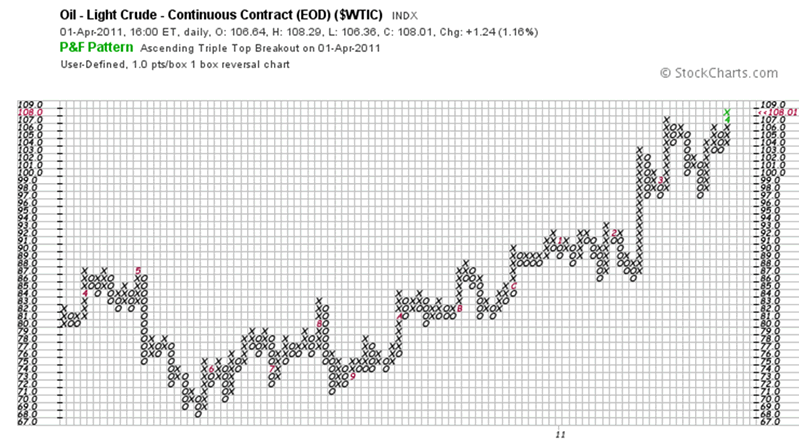
The base count for WTIC (chart courtesy of StockCharts.com) taken across the 76.00 level to the low of the move, gives us a projection to 107 which was reached on 3/7. By adding the phases prior to 3/7 to the 107 count, we get 109, 111, and 115. If 115 is reached, it could be followed by a substantial correction. Before we get there, 109 and 111 could prove to be pauses along the way, as was 107.
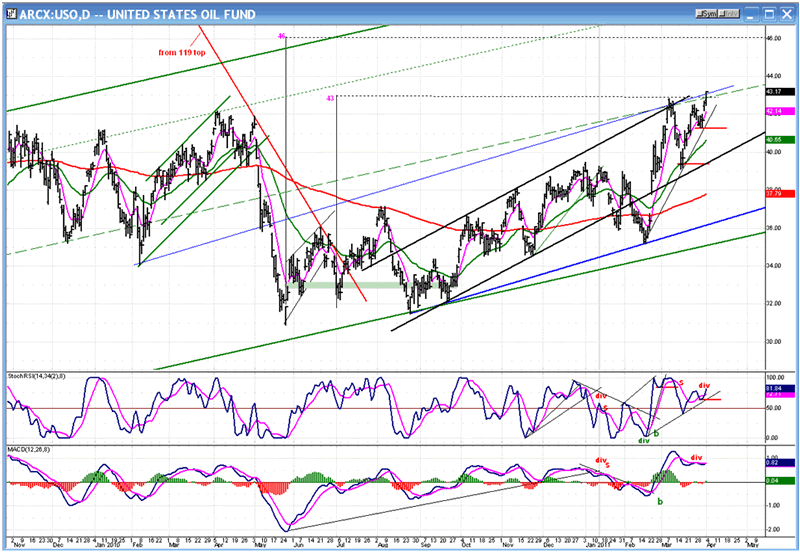
The chart of USO filled its 43 count on Friday, but since it had already essentially reached it on 3/7 and has consolidated since, it may continue on its way to the 46 target -- although the indicators are showing negative divergence and not really supporting an extended price move.
Summary
Last week, because of some overhead resistance, I anticipated a potential pull-back before going higher. There was one, but it was very brief and shallow. The scenario that I had foreseen is more likely to take place now that we have reached the 1334 projection.
FREE TRIAL SUBSCRIPTON
If precision in market timing for all time frames is something which is important to you, you should consider a trial subscription to my service. It is free, and you will have four weeks to evaluate its worth.
For a FREE 4-week trial. Send an email to: ajg@cybertrails.com
For further subscription options, payment plans, and for important general information, I encourage you to visit my website at www.marketurningpoints.com. It contains summaries of my background, my investment and trading strategies and my unique method of intra-day communication with Market Turning Points subscribers.
By Andre Gratian
MarketTurningPoints.com
A market advisory service should be evaluated on the basis of its forecasting accuracy and cost. At $25.00 per month, this service is probably the best all-around value. Two areas of analysis that are unmatched anywhere else -- cycles (from 2.5-wk to 18-years and longer) and accurate, coordinated Point & Figure and Fibonacci projections -- are combined with other methodologies to bring you weekly reports and frequent daily updates.
“By the Law of Periodical Repetition, everything which has happened once must happen again, and again, and again -- and not capriciously, but at regular periods, and each thing in its own period, not another’s, and each obeying its own law … The same Nature which delights in periodical repetition in the sky is the Nature which orders the affairs of the earth. Let us not underrate the value of that hint.” -- Mark Twain
You may also want to visit the Market Turning Points website to familiarize yourself with my philosophy and strategy.www.marketurningpoints.com
Disclaimer - The above comments about the financial markets are based purely on what I consider to be sound technical analysis principles uncompromised by fundamental considerations. They represent my own opinion and are not meant to be construed as trading or investment advice, but are offered as an analytical point of view which might be of interest to those who follow stock market cycles and technical analysis.
Andre Gratian Archive |
© 2005-2022 http://www.MarketOracle.co.uk - The Market Oracle is a FREE Daily Financial Markets Analysis & Forecasting online publication.