


Crude Oil Price Drivers
Commodities / Crude Oil Apr 11, 2011 - 08:08 AM GMTBy: John_Hampson

 1. Developments in the Middle East and North Africa - A real supply loss in Libya and fear of supply loss elsewhere. The fear factor and uncertainty premium is likely to last all the way through to new elections, but intermittent 'good news' from the region should ease the oil price.
2. Excessive liquidity and speculative momentum - Due to low interest rates in the developed world, money is encouraged to seek a return in hard assets. In the world's largest economy we still remain some way from a rate rise from current 'negligible' levels. Monetary stimuli such as quantitative easing create more money chasing the same amount of real assets. A lack of QE extension beyond QE2 would help reduce the tide of money.
3. A secular bull market in commodities - Born out of underinvestment in supply in the 1980s and 1990s and increased global demand (industrialisation of China, global population growth). This provides an ongoing anchor for oil investors and speculators, although not forever (lagged supply increases, alternative fuel growth, China derailing, global recession). One measure of the secular progression is the Dow-Oil ratio, which currently stands at 110 but reached as low as 20 at the last secular commodities bull conclusion around 1980.
Underlying Source: Approximity
4. Peak Oil - Where demand permanently exceeds supply. Whilst this may transpire in our current decade, it is less relevant short term, because although global demand is currently back at all time high levels, crude stocks remain ample (above the historical average due to slack built up during the recession of 2007-9).
Source: EIA
5. Global growth - Leading indicators and global growth forecasts continue to point to 2011 being a strong year. However, higher crude oil prices crimp growth (every $10 rise cuts growth by roughly 0.25%), and historically when global fuel expenditure reaches 5% of GDP economic slumps typically occur. If crude prices remain above $100 for the rest of the year then that level should be reached.
Source: Danske Markets
Those countries most at risk from negative growth impacts by rising energy prices are Korea and Singapore.
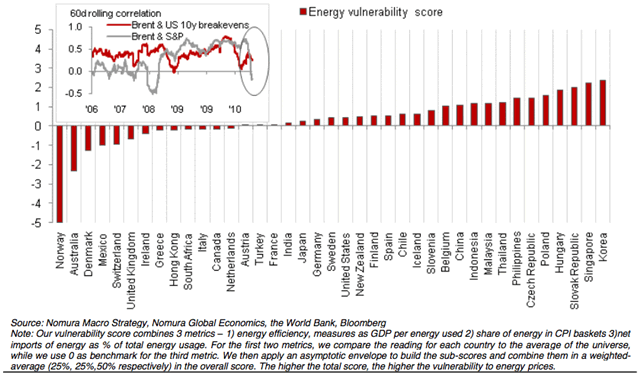
Source: Nomura / Short Side Of Long
6. A hedge against inflation - Shadowstats 'undoctored' inflation statistics suggest a rising rate that is already around 9% annual in the US, and inflation appears set to accelerate, as suggested by the chart below. Clearly a feedback loop is possible, as rising oil creates higher price inflation which encourages more money into oil.
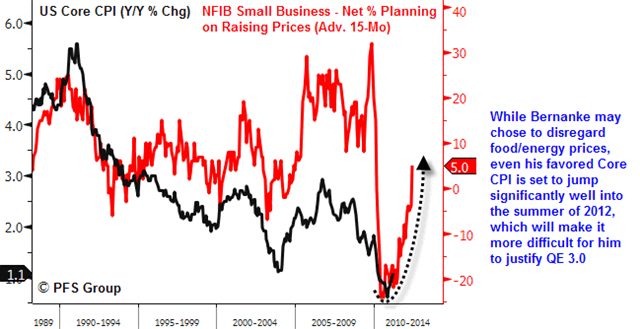
Source: Chris Puplava
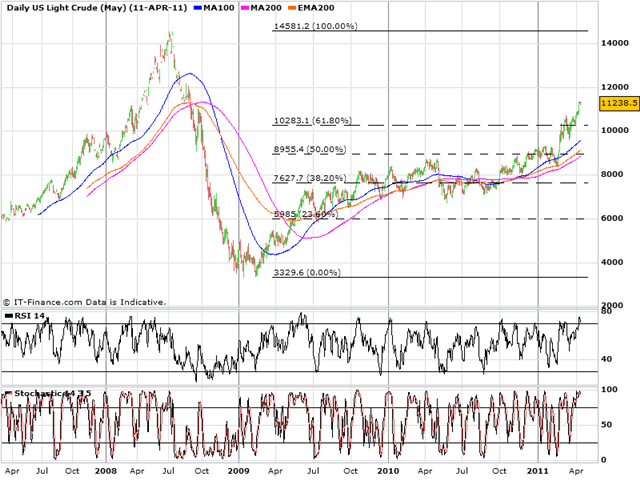
7. Technical analysis - By TA, WTI Crude is destined for a 100% retracement of its 2008 falls, having broken decisively beyond the 61.8 fib. Brent is yet closer to this target, and technical traders may have their eyes on this double top prize.
8. A weak US Dollar - As WTI Crude is priced in US Dollars, there has historically been an inverse relationship between the two. The major component of the US Dollar index's fortunes is the Euro-USD pair, and as the chart shows, the contract broke out beyond key long term declining resistance. However, the extreme USD bearishness readings remain a contrarian warning sign and we can next look to Fib and pitchfork resistance (shown) as another potential reversal point.
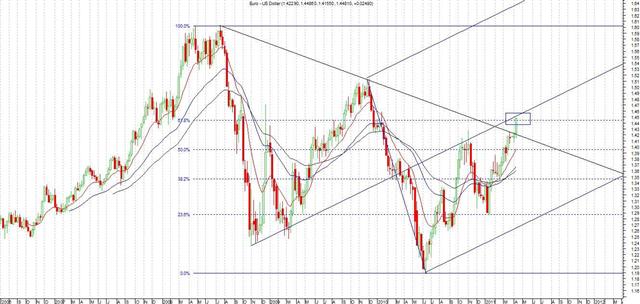
Underlying Source: Swing Traders Edge
9. Crude Oil price versus futures price 11 months out - History suggests crude does not peak until the current contract price is around $5 higher than the contract price 11 months out. Currently we are half a dollar under the 11 month price so there is some way to run.
10. Solar Cycles - Solar cycles forecast a price peak of at least $200 around 2013, and an extreme relative price peak to stocks at that time. Solar cycles predict inflation and growth into 2013 and a recession thereafter. For realisation, oil cannot run up too far too fast from current levels, but a sustained pause or pullback en route is by implication required.
Underlying Source: NOAA
John Hampson
John Hampson, UK / Self-taught full-time trading at the global macro level / Future Studies
www.amalgamator.co.uk / Forecasting By Amalgamation.
© 2011 Copyright John Hampson - All Rights Reserved
Disclaimer: The above is a matter of opinion provided for general information purposes only and is not intended as investment advice. Information and analysis above are derived from sources and utilising methods believed to be reliable, but we cannot accept responsibility for any losses you may incur as a result of this analysis. Individuals should consult with their personal financial advisors.
© 2005-2022 http://www.MarketOracle.co.uk - The Market Oracle is a FREE Daily Financial Markets Analysis & Forecasting online publication.