


Why High Crude Oil Prices Are Likely Here to Stay
Commodities / Crude Oil Apr 12, 2011 - 04:49 AM GMTBy: Frank_Holmes

 A number of forces continued to push oil prices higher last week, reaching their highest levels in the U.S. since September 2008.
One factor fueling the run has been the continued decline of the U.S. dollar. You can see from the chart that oil and the dollar historically are negatively correlated. This means that a rise in oil prices generally coincides with a decline in the dollar, and vice versa. The U.S. dollar has seen a dramatic decline since the beginning of the year as oil prices have moved some 30 percent higher. This could be due to fact that roughly two-thirds of the U.S. trade deficit is related to oil imports.
Despite the run up, oil’s upward rate of change is still within its normal trading pattern over the past 60 trading days. Accordingly, this may imply that it isn’t a spike and we haven’t crossed into the extreme territory like we experienced in 2008 and 2009.
Conversely, oil prices are positively correlated with gold prices, which also saw a bounce this week. Looking back over the past one- and 10-year periods, oil and gold have roughly a 75 percent correlation. This means that three out of four times, when prices for one go up, prices for the other increase as well.
Another factor pushing prices higher is the seasonal strength that oil prices historically experience leading into the summer driving season. This chart shows the five-, 15- and 28-year patterns for oil prices. You can see that prices historically bottom in February before rising through the end of the summer.
We discussed in detail how these seasonal factors affect oil prices a few weeks ago. Click here to read “Oil’s March Madness a Boost for Refiners.”
Rising oil prices are also a result of what the Financial Times calls the “new geopolitics of oil.” The FT says three elements creating this new environment are becoming clear:
- Young populations with high unemployment rates and a skewed distribution of income are a volatile combination for the people in power.
- To placate these groups, oil-producing countries are increasing public expenditures.
- Governments are also to extend energy subsidies to shelter the country’s consumers from rising energy prices.
A Deutsche Bank chart plots the share of population under the age of 30 for selected North African and Middle Eastern countries against the unemployment rate of this group. You can see that large oil producers such as Saudi Arabia have a high level of unemployment among youth populations.
This is why King Abdullah of Saudi Arabia has announced a total of $125 billion worth (27 percent of the country’s GDP) on social programs for the public. For King Abdullah, this is the cost of keeping peace but has driven up the breakeven price for Saudi oil production to $88 per barrel, according to the FT.
Keeping these young populations happy and working is not only domestically important for these governments but for global oil markets as well. You can see from this chart that a significant portion of the world’s oil production comes from the Middle East.
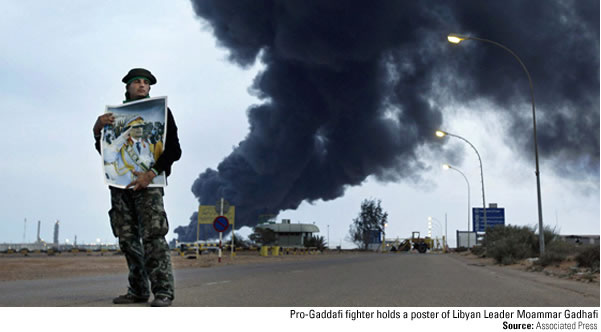
With the unrest in Libya—a top-20 oil producer—essentially knocking out the country’s entire production, any further unrest in another country could threaten global supply. Upcoming elections in Nigeria have the potential to disrupt production for the world’s fifteenth-largest producer.
But it’s not just geopolitics that is threatening production. Natural decline rates from mature fields such as Mexico’s Cantarell oil field are starting to make a dent in global production. Reuters reported this morning that Norway, the world’s eleventh-largest oil producer, is experiencing a significant slowdown in production from the Oseberg oil field in the North Sea. Production is expected to be cut by 26 percent in May to only 118,000 barrels per day.
Meanwhile, oil demand has been picking up significantly in both emerging and developed markets. Oil demand in China and the U.S. has been rising since mid-2009, well before the uprisings began in the Middle East.
In China, a big driver has been growth in the Chinese automobile market. Auto sales increased 2.6 percent in February, and March data released by the Chinese Auto Association over the weekend shows auto sales grew 5.36 percent on a year-over-year basis in March.
The G7 economies have been in an up cycle since last year. In the U.S., employment rates and consumer spending have been steadily improving. Oil prices rising too fast remains a threat to this recovery but BCA Research estimates that oil prices need to rise above $120 per barrel before “significantly undermining consumer and business confidence.”
For more updates on global investing from Frank and the rest of the U.S. Global Investors team, follow us on Twitter at www.twitter.com/USFunds or like us on Facebook at www.facebook.com/USFunds. You can also watch exclusive videos on what our research overseas has turned up on our YouTube channel at www.youtube.com/USFunds.
Please consider carefully the fund's investment objectives, risks, charges and expenses. For this and other important information, obtain a fund prospectus by visiting www.usfunds.com or by calling 1-800-US-FUNDS (1-800-873-8637). Read it carefully before investing. Distributed by U.S. Global Brokerage, Inc.
Standard deviation is a measure of the dispersion of a set of data from its mean. The more spread apart the data, the higher the deviation. Standard deviation is also known as historical volatility. All opinions expressed and data provided are subject to change without notice. Some of these opinions may not be appropriate to every investor. The S&P 500 Stock Index is a widely recognized capitalization-weighted index of 500 common stock prices in U.S. companies. The NYSE Arca Gold BUGS (Basket of Unhedged Gold Stocks) Index (HUI) is a modified equal dollar weighted index of companies involved in gold mining. The HUI Index was designed to provide significant exposure to near term movements in gold prices by including companies that do not hedge their gold production beyond 1.5 years. The MSCI Emerging Markets Index is a free float-adjusted market capitalization index that is designed to measure equity market performance in the global emerging markets. The U.S. Trade Weighted Dollar Index provides a general indication of the international value of the U.S. dollar.
Frank Holmes Archive |
© 2005-2022 http://www.MarketOracle.co.uk - The Market Oracle is a FREE Daily Financial Markets Analysis & Forecasting online publication.