The Myth of Japan's Economic Depression Lost Decades
Economics / Japan Economy Apr 15, 2011 - 12:11 PM GMTBy: Kel_Kelly
 The earthquake, tsunami, and lingering nuclear crisis in Japan have devastated that country's people and their place in the global economy. Can the island nation recover? To see where Japan might go next, we have to look at one of the persistent myths about its recent past — the myth of the lost decades.
It is widely thought that Japan is in the 21st year of a recession, or at least of a muddle-through sluggish economy. Part of this poor performance, economists and the financial press habitually state, is that Japan has experienced a terrible deflation. Nevertheless, I claim that Japan's economic state for the past two decades, up until the recent disasters, has in fact been comparable to that of most developed nations.
 I was encouraged to write this article after Gary North recently provided yet more circumstantial evidence that corresponds to the beliefs I've held about Japan for a very long time. My goal here is to contextualize this evidence and reconcile it with the official economic data published about Japan.
What Is Economic Growth?
To understand Japan's actual economic growth, we first have to agree on just exactly what economic growth is: it is the production of goods and services. All of our banks, factories, tools, trucks, natural resources, and labor are used almost solely for the ultimate purpose of producing consumer goods — things that we each want and need in our lives in order to stay alive, remain healthy, clothed, and comforted, to enjoy life and to live as well as possible.
An increased standard of living (material well-being, not spiritual or psychological well-being) consists of having more things. The more things we produce — medicines, heaters, sofas, clothes, hammers, sandwiches, suntan lotion, etc. — the better off our lives.
As I will explain below, an economy's growth is not easily or accurately measured with a calculation based on the dollar amount of money spent on goods. Not only are statistical indices like GNP and GDP inaccurate, they are unneeded as far as observing real economic growth. Ordinary citizens in Denmark do not need to compare GDP per capita to know that they live better than ordinary citizens in Somalia. One can simply look around and see what kind of homes, streets, restaurants, grocery stores, and other goods and services are available in each of these countries, and how many hours of labor are needed to acquire these things.
Similarly, in any particular country, one can look around and see whether there are increasing amounts of goods and services over time — i.e., whether there is a positive rate of change of economic growth. The true test of economic growth is whether or not a given amount of physical labor can acquire more goods and services each year.
A Citizen's View of the Japanese Economy
Gary North recently featured two articles describing Japan and Japanese life by people who live there.[1] Below are some of their statements:
-
"But, I would argue, Japan in 2011 for very, very many who live here is a much better place than the headlines might lead one to believe."
-
"Condos sprout like mushrooms and mortgages can be paid off in decades, not in tens of decades."
-
"As I look out from one of the newsrooms in our 35-floor headquarters, built during one of the Lost Decades, I see what was a nearly abandoned railroad yard 15 years ago is now a virtual forest of 20- to 50-storey buildings where more than 60,000 people a day now work.
A decade ago, these were just holes in the ground." -
"Around our condo in Yokohama, shopping malls, offices, condominiums and single-family housing have been popping up nearly every day of the last two decades."
-
"Those years may be the Lost Decades, but they have not been the Do-nothing Decades."
-
"Thirty years ago, when my wife and I lived about two hours outside Tokyo next to a 'small town' of about 600,000, we had to go to one of only a handful of shops in Tokyo to buy a piece of decent cheese.
Now, cheese is nearly ubiquitous, and half the price it was 30 years ago." -
"The strong yen, so much the bane of exporters, is the domestic consumer's friend.
Imported cars, food, clothing, even energy and raw materials for industry all cost less now than 20 years ago.
A nice bottle of Italian wine that sells for about $15 in Tokyo carried a price tag of $41.95 in Vancouver during the Olympics last year." -
"Restaurants now offer the finest foods the world has to offer at prices most can afford."
-
"Hotels prices are again reasonable, train fares are affordable and airfares, particularly for overseas travel, are barely [recognizable] from those in the days it took nearly a month's salary to fly to Toronto and back."
-
"Certainly anyone who visits Japan these days is struck by the obvious affluence even among average citizens. The cars on the roads, for instance, are generally much larger and better equipped than in the 1980s"
-
"Overseas vacation travel has more than doubled since the 1980s. The Japanese boast the world's most advanced cell phones, and the biggest and best high-definition television screens. Japan's already long life expectancy has increased by nearly two years. Its Internet connections are some of the world's fastest — something like ten times faster on average than American speeds."
-
"The label on everything from cell phones to laptop computers may say 'Made in China' but actually, via producers' goods, highly capital-intensive and knowhow-intensive manufacturers in Japan have quietly done much of the most technologically demanding work."
-
"The [producers' goods] competition has come principally from Japan, which now enjoys broadly as dominant and geopolitically important a position as the United States did in the 1960s. Even if you don't hear much about this from the Tokyo talking heads, it is hard to miss it in global trade figures."
-
"And this is now a kinder, gentler place."
It's All About the Numbers
So how do we reconcile the discrepancy between the official economic data and the circumstantial empirical data above? The answer I suggest is that the official data are flawed, because they are based on bad economic theory and statistics trying to aggregate factors that can't easily be aggregated. The core of the discrepancy is that (official) economic growth is being measured in money, and money is not wealth.
The misleading measurement of growth in question is GDP growth, because it is practically the sole indicator used by professionals to assess economic output. The problem is that GDP is in fact not a measure of real, physical production of goods and services, as it is intended to be. It is primarily a measure of inflation, which it is not intended to be. To understand this, we must be clear on what inflation is and what causes it.
In short, prices can rise overall throughout an economy only if the quantity of money in the economy increases faster than the quantity of goods and services. (In economically retrogressing countries, prices can rise because the supply of goods diminishes.)
When the supply of goods and services rises faster than the supply of money — as happened around the world during most of the 1800s — the unit price of each good or service falls, because a given supply of money has to buy, or "cover," an increasing supply of goods or services. George Reisman offers us the critical formula for the derivation of economy-wide prices:

In this formula, price (P) is determined by demand (D) divided by supply (S).[2] Aggregate prices consist of the amount of money spent to buy everything in the economy, divided by the quantity of items sold. The formula shows us that it is mathematically impossible for aggregate prices to rise by any means other than (1) increasing demand, or (2) decreasing supply — i.e., either by more money being spent to buy goods, or by fewer goods being sold in the economy.
In our developed economy, prices are rising due to more money entering the marketplace, not because the supply of goods is decreasing — or at least they are not decreasing at enough of a pace to raise prices at the usual rate of 3 or 4 percent per year.
The same price formula noted above can equally be applied to asset prices — stocks, bonds, commodities, houses, oil, fine art, etc., and also to corporate revenues and profits. As Fritz Machlup states,
It is impossible for the profits of all or of the majority of enterprises to rise without an increase in the effective monetary circulation (through the creation of new credit or dishoarding).[3]
In sum, the price of anything in the economy — absent economic retrogression — can rise only with more money and spending. Even though prices of particular goods or commodities can rise from a relative increase in demand, it is impossible for the prices of a majority of goods or assets to rise simultaneously without additional money pushing them higher.
A progressing economy is one in which an increasing quantity of goods is produced over time. It is real "stuff," not money per se, that represents real wealth. Further, if goods are produced at a faster rate than money, prices will fall. With a constant supply of money, wages would remain the same while prices fell, because the supply of goods would increase while the supply of workers would not. But even when prices rise due to money being created faster than goods, prices still fall in real terms, because wages rise faster than prices due to the same expansion of the supply of goods relative to the supply of labor. In either scenario, if productivity and output are increasing, goods get cheaper in real terms.
Obviously, then, a growing economy is reflected in prices falling, not rising. No matter how many goods are produced, if the quantity of money remains constant, the only money that can be spent in an economy is the particular amount of money existing in it (and velocity, or the number of times each dollar is spent, could not change very much if the money supply remained unchanged).
Therefore, GDP, which measures money prices, does not necessarily tell us much about the number of actual goods and services being produced; it only tells us that if GDP is rising the money supply must be rising, because a rise in GDP is mathematically possible only if the money price of individual goods produced is increasing to some degree. Otherwise, with a constant supply of money and spending, the total amount of money companies earn (the total selling prices of all goods produced) and thus GDP itself would all necessarily remain constant year after year.
To be perfectly clear, this means that price deflators applied to GDP calculations to adjust for price inflation do not fully deflate GDP. If they did, real GDP growth would, by mathematical necessity, be zero. (For a more detailed exposition on GDP, see pp. 423–427 in Kelly, The Case for Legalizing Capitalism).
While GDP can increase only with more money and spending, it is obvious that the only source of an increase of money and spending is an increase in the supply of money itself, which in turn can come only from the central bank. Businesses do not create money; they create goods and services. Only the central bank and the member banks have the ability to create money.[4]
When central banks pump a lot of money into the economy, they boost GDP growth (along with corporate revenues and especially profits). Conversely, when they don't, GDP does not grow very much. Thus, Japan's GDP growth has been slow because Japan's central bank, The Bank of Japan (BOJ), has intentionally engaged in a conservative monetary policy for most of the last 20 years, as seen in figure 1. The growth of the monetary base averages less than about 5 percent per year. While M1 money supply bounces around, it averages less than 10 percent while the broader M2 money supply averages 2–3 percent. Consumer price inflation, in turn, as shown in figure 2, has remained near flat.
That last sentence is worth repeating: consumer prices have been mostly flat — not falling. The "deflation" Japan is supposed to have experienced over the last 20 years — as commonly stated by financial journalists and professional economists — really consists of prices periodically falling 1, 2, and sometimes 3 or 4 percent over a year or two before returning to slight positive growth rates. All in all, consumer prices have seen a slight increase, not decrease over the last two decades.
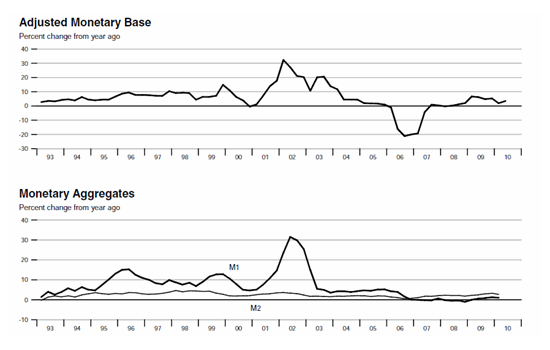
Fig. 1. Japan's monetary base and money supply, 1993–2010. Source: Federal Reserve Bank of St. Louis.
 Fig. 2. Japan's rate of consumer price inflation, 1993–2010. Source: Federal Reserve Bank of St. Louis.
Now observe in figure 3 how much lower money-supply growth has been in the 1990s and 2000s as compared to the 1980s. In figure 4, describing that same time frame, you will notice a reduction of GDP; it went from being in the 4 percent to 10 percent range in the 1980s to the −2 percent to +2 percent range in the 1990s and 2000s.
The same evolution is presented from a slightly different angle in figure 5, where, instead of real-time changes as depicted in figures 3 and 4, GDP and money supply are smoothed in the form of a 40-quarter (10-year) compound annual growth in Japanese nominal GDP and the 120-month (10-year) compound annual growth in the Japanese M2 money supply.
It should be noted that, because it takes time for new money to multiply and be disseminated in the fractional-reserve system, money supply has a delayed effect of about one to two years on GDP growth.
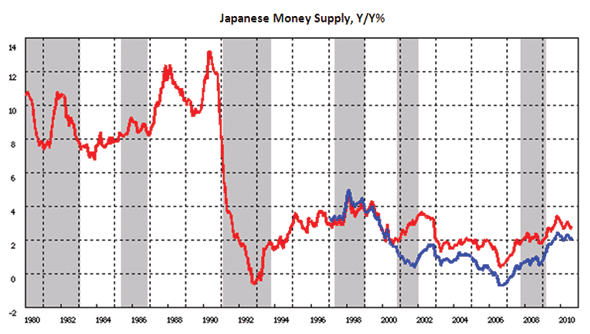 Fig. 3. The decline in Japan's money-supply growth rate since the 1980s. The red line is M2, and the blue line is M3. Source: Bank of Japan.
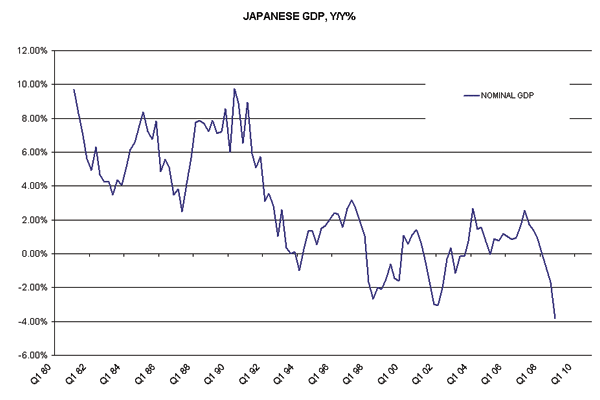 Fig. 4. The decline in Japan's GDP growth rate since the 1980s. Source: Seeking Alpha.
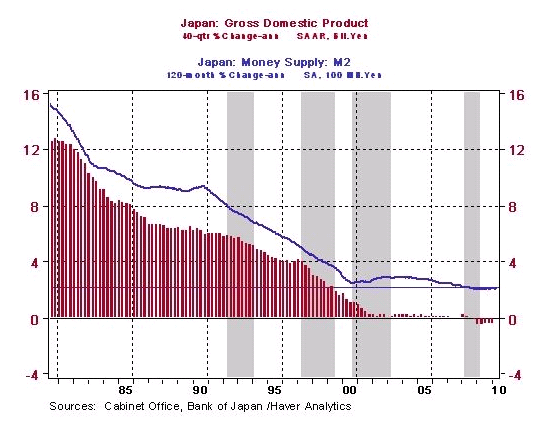 Fig. 5. Japan's GDP and money supply moving together.
The lagged money supply affects both GDP and prices (because GDP consists of prices). As would be expected, Japan's GDP and M2 have moved largely in line with each other (figure 5). Notice that after the money supply dropped precipitously in 1990 (as seen in figure 3), GDP, after peaking, fell off over the next two years (as seen in figure 4).
The sharp decline in the money supply (and corresponding spending levels — velocity changes in the financial markets, in this case) shown in figure 3 is what is responsible, not only for the ensuing decline in prices and GDP, but also for the more immediate decline in asset prices in Japan. Figure 6 shows the dramatic boom-and-bust sequence of Japan's real-estate prices, and figure 7 shows the same for its stock market. The real estate market fell 85 percent from its high, while the stock market fell 82 percent from its high — just as the Dow Jones fell 89 percent from its high after 1929, due to the US money-supply collapse.
Asset prices rose more dramatically than consumer prices in Japan during the 1980s boom because, of the tremendous amount of money created, disproportionately more was inserted into the financial system than into the real economy. In other words, most of the new money created was used for financial investment and speculation rather than for spending on capital, labor, and consumer goods. Logically, when credit creation slowed in the late 1980s — and the inevitable spending reduction, bank/business losses, and monetary contraction appeared — the evaporation of money and the consequent selling of assets occurred in the financial markets much more than in the real economy. What went up the most came down the most. On the downswing, the asset markets deflated; but the real economy — and GDP — not as much.
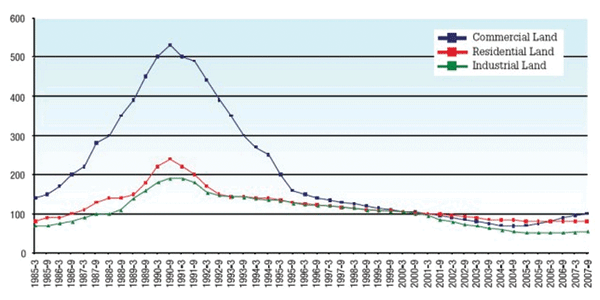 Fig. 6. The Japanese real-estate-market boom and bust (six large city areas). Source: Japan Real Estate Institute.
 Fig. 7. The Japanese stock-market boom and bust (Nikkei 225 Stock Index). Source: Yahoo Finance.
It is precisely because the money supply has not been pumped back up and directed into the financial markets that the Japanese stock market has remained dead for the last two decades. And unless Japanese consumers decide to forego consumer goods — including their houses — and buy stocks, it will remain dead until more newly created money from the BOJ pushes it higher. But, crucially, the "dead" stock market harms neither Japanese consumers nor the Japanese economy.
Proof of Japan's Growth
So far we have seen evidence that there was a decline in Japan's money supply, and therefore in consumer prices, asset markets, and GDP growth. I have also said that GDP growth per se is merely a statistic that does not represent real economic growth. The primary goal of this paper is to show that while GDP has grown at a snail's pace, real economic growth has been rather robust — approximating real economic growth in other developed countries.
If Japan, as I claim, has indeed seen economic growth similar to other developed nations, we would expect its GDP per capita to have remained in line with theirs. Though GDP growth of a single country does not tell us much, a comparison of GDP per capita between countries does. This is due to the fact that GDP is mainly a measure of money. Largely free-floating currencies, such as those of Japan and the United States, are adjusted by the markets so as to maintain relative prices between the two countries in order to keep purchasing power at parity. This (largely) cancels out inflation-induced changes. In similar fashion, adjusting GDP per capita by a calculated purchasing-power-parity (PPP) figure should also compensate for changing inflation rates between Japan and the United States.
For example, if the United States expands the money supply at twice the rate of Japan, America's consumer prices and GDP should rise at approximately twice the rate of Japan (though relative stated GDP changes in various countries — as well as their price deflators — are quite questionable due to their being subjected to different levels of calculation manipulation by the respective authorities). Because there is then twice the excess amount of dollars relative to yen and double the prices in the United States relative to Japan, the dollar should fall by half against the yen. This adjustment for money and prices keeps respective GDP values adjusted in real terms.
Now let's look at the data. If Japan's economy has truly remained mostly flat, as most of the financial world claims, while America's has mostly risen, then Japan's GDP per capita, as measured in dollars at purchasing-power parity, should be not too far above where it was in 1990 at the beginning of Japan's "lost decades." It should certainly not be at the same level relative to America's or Europe's GDP per capita. In this case of largely flat growth, a chart of GDP per capita would look similar to figure 8, which shows the GDP per capita of Sierra Leone, or figure 9, which shows that of Haiti, which rises slightly.[5] In other words, it should look like the GDP per capita growth trend of countries that truly haven't grown very much.
But in fact, Japan's GDP per capita at PPP has increased consistently, as figure 10 shows. In other words, GDP per capita in Japan has grown through time,[6] rising from $19K per capita in 1990 to $34K in 2010. Similarly, the United States had a GDP per capita of $23K in 1990, and it is at $46K today. America's GDP per capita is thus 100 percent higher than in 1990, while Japan's is 79 percent higher. This is close enough to call it somewhat comparable. (Keep in mind that these formal GDP per capita calculations are far from precise and reliable; it is entirely possible that real growth in Japan is, say, 105 percent higher while that of the US is 85 percent higher. The point is that even the official data produced by professional economists show that Japan has grown considerably.)
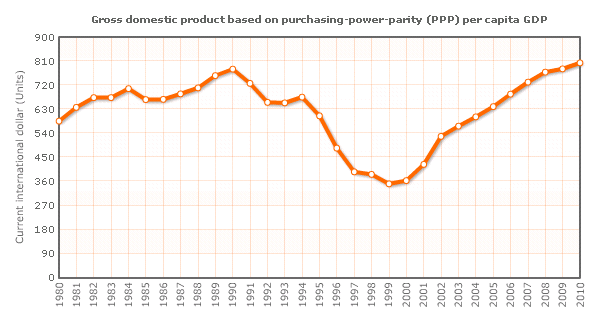 Fig. 8. The sluggish economy of Sierra Leone. Source: International Monetary Fund, "World Economic Outlook," April 2010.
 Fig. 9. The sluggish economy of Haiti. Source: International Monetary Fund, "World Economic Outlook," April 2010.
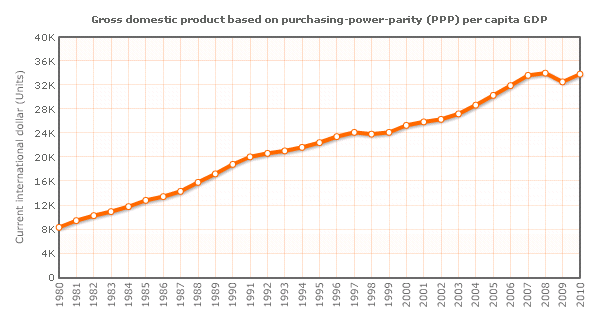 Fig. 10. Japan's increasing GDP per capita over time. Source: International Monetary Fund, "World Economic Outlook," April 2010.
Figure 11 shows another view of the same phenomenon, and the best proof that Japan has grown in line with other developed countries. The chart shows GDP per capita across the OECD countries (a group of developed and mostly-developed countries) in both 1987 and 2007. Japan's GDP per capita in 1987 (the light blue bars) was just about completely in line with Germany's and France's, the countries directly above and below Japan in this ordered ranking. Twenty years later in 2007 (the dark blue bars) Japan still had GDP in line with the same two countries — just slightly below Germany's and just slightly above France's. The proportions are unchanged!
If it were true that Japan has seen dramatically slower growth over the last 20 years than have other developed countries, Japan could not still have the same relative position in GDP per capita 20 years later. Judging by the size of the light blue 1987 bars, Japan had about the same relative proportions then as now (or as in 2007 in this case, just before the world financial crisis arrived). So, if Japan has been in a recession the last two decades, then so have Germany and France and other developed countries. In fact, Japan, after all its supposed lack of growth, still ranks above the OECD average.
Clearly, GDP growth is an uninformative measure. Japan's economy has been healthy even though economists the world over have bemoaned its stagnant growth.
 Fig. 11. Japan's GDP per capita remaining in the same proportion as other countries. Source: "OECD in Figures 2008," OECD Observer.
Additional Explanations and Reconciliations
The Rising Currency
One might think that part of the reason that Japan has seen its GDP per capita increase over the last 20 years is that its stronger currency translates its GDP — when using currency values instead of PPP — to a higher number. But the currency movement is not responsible. The currency has risen precisely to adjust for relative prices, because Japan has had less price inflation due to having created less money and credit (in fact, the rise of the yen really reflects the fall of other currencies). The currency changes have kept the GDP measurement accurately adjusted.
The higher currency has helped, not harmed, the Japanese people, by giving them more purchasing power domestically. It has not made much of a difference internationally, because the currency has simply adjusted for prices. A country can print lots of money or not, but free-floating currencies will adjust for real purchasing power.
Had Japan printed no money at all over the last 20 years, it would have seen its currency rise even more. Additionally, domestic prices would have fallen. This would not have been deflation, which is falling prices due to a contraction of the money supply. It would have been falling prices due the fact that goods and services were being created faster than was money. Unlike deflation, falling prices help everyone.
Prices have stayed mostly flat in Japan because the quantity of money has increased at about the same pace as the quantity of goods. And with respect to goods prices specifically, the money supply has effectively increased at a faster rate than official monetary aggregates because money has flowed out of the equity and housing markets and into the consumer-goods markets. More money is not needed to grow an economy, as any amount will do; prices will adjust to the quantity of money — just as they do when money is created faster than goods. In fact, the less money is created, the faster the real economy will grow.
How Did the Economy Expand without Bank Loans and Credit Growth?
Given my exposition of Japan's true growth, many might wonder exactly how Japan's economy has grown without much credit creation and bank lending, because it is well known that Japanese banks have been carrying bad loans on their books for many years, and that they are hesitant to lend for that and various other reasons.
To begin with, banks have actually been lending, just at reduced rates relative to historical standards (and in part because of the fact that money and thus credit are being created at a reduced rate). Also, there are other types of lenders today in Japan in addition to traditional banks.
But, more importantly, it needs to be understood that new credit is not required for a country to prosper. In fact, more credit — as opposed to more real savings — creates economic problems and slows an economy.
Once prices adjust to the newest credit created, the amount of credit available in an economy reflects the amount of real monetary savings. To then create additional credit in excess of real savings increases the amount of claims used to acquire the very same real, physical capital that the real savings is intended to purchase — this is similar to a game of musical chairs where, instead of chairs being taken away, people are added. After prices adjust, all the credit that existed prior to the creation of the new credit has been diluted by the addition of the new credit. Thus, creation of fiat money reduces the real purchasing power of each unit of savings and of previously created credit once price inflation sets in.
Artificially created credit also causes economic boom-and-bust sequences due to the malinvestments and subsequent liquidations that excessive, false savings (i.e., credit masquerading as savings) creates. The new money artificially alters interest rates, profits, relative prices, and other market signals, causing a misallocation of capital that unnaturally expands some industries relative to others. The more credit created, the more is the economic distortion of the production structure, and the greater is the corrective process required once the money flow slows or stops. The more economic distortion that comes about, the more real capital that is ultimately destroyed through malinvestment. (For a relatively concise explanation of this process, see pages 141–155 in my book.)
Japan has not been creating credit at a high rate, so it has not diminished the value of its real savings through inflation or through financial and economic booms and busts at a high rate (compared to Japan previously, and to other countries).
It is critically important to understand that if a country does not continually destroy real savings and real capital through credit creation and inflation, it does not need to continually save and accumulate new funds for investment. The idea of seeking more and more savings for investment purposes each year in most countries is prevalent only because the current stock of monetary savings and capital is continually being diminished by credit creation and inflation (this aside from the physical capital which is destroyed via malinvestment).
When credit is not diminished in this way, it remains intact, and its value increases through time as prices fall. In this way, the same capital can fund more investments through time, and new and additional capital is not constantly needed to replace previous capital.
The fact is that in an economy without inflation and boom-and-bust scenarios — both of which destroy capital — the very same capital base can grow an economy without new savings. All that's needed is that a sufficient proportion of the existing physical capital be allocated to the production of capital goods relative to the production of consumer goods. An economy's capital goods — its tools, factories, machines — and the corresponding labor devoted to capital-goods production produce all new capital goods as well as all new consumer goods.
As long as enough monetary demand — out of the same annual lump of money existing in the economy — is geared toward capital goods versus consumer goods each year, there will be enough production of capital goods to (1) replace the capital goods worn out in production (2) produce a greater net amount of capital goods than were produced the previous year. An increasing amount of capital goods each year will produce an increasing amount of consumer goods each year (and as the supply of goods increases relative to the static supply of money, prices will fall by the year).
For a visual understanding of this, see George Reisman's example from his book Capitalism (p. 625) in figure 12. Here, the amount of capital goods (set of boxes on the left side) produced each year is in excess of the amount needed to replace used up capital goods (and this simple model assumes all goods are used up each year). This leads to a constantly expanding amount of capital goods (1.2K, 1.44K, 1.728K, etc., where "1K" represents any given physical amount of capital). The process is similar to compound-interest growth.
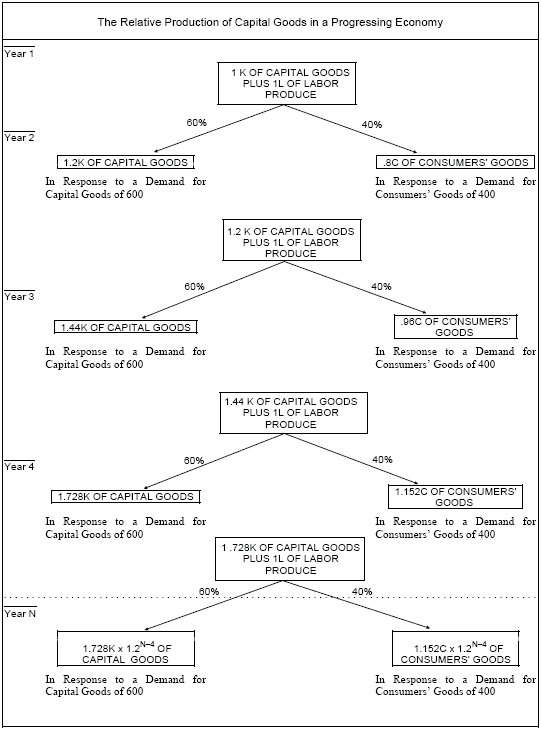 Fig. 12. A model economy growing without additional capital being added.
Each year, because more capital goods are created, so are more consumer goods (the boxes on right side, which represent the amounts consumed). The key is having a sufficient proportion of monetary spending devoted to production instead of consumption: in this case, 60 percent to capital goods and 40 percent to consumer goods. All production is done without any new and additional savings or credit. The same amount of physical savings (the original 1K of capital in year 1) that the same amount of monetary savings/demand (the 600 units of money/spending) purchases is used each year to produce a constantly increasing amount of capital, goods, and services.[7] Any new and additional (real) savings/demand on top of this — a ratio of, say, 70/30 — would simply increase the rate of growth of production. For perspective, it should be understood that if the ratio was low enough, such that the amount of capital and consumer goods produced would exactly offset the amount used up, the economy would be stationary — it would neither grow nor shrink. And if it were even lower, the economy would retrogress.
Returning to the case of Japan, because the country has destroyed and inflated away very little savings and capital over the last 20 years — that is, because it has largely been using the same capital — the evolution of its production structure is similar to that in our example. True, capital is destroyed each year via consumption spending (i.e., stimulus spending, social welfare spending, etc.,), smaller boom-bust sequences, regulation/restrictions, and other government distortions, but there is enough capital being created each year, in addition to the high level of domestic savings available, to cover that amount of capital loss.
Even before the recent financial and economic crises, all developed economies experienced similar annual destruction of capital through taxes and other interventions. All economies are distorted and consume capital in myriad ways. But on a net basis, the capital destroyed is offset — if only slightly — by new capital created. Japan simply has different distortions — and strengths — from other countries.
Figure 11 also helps us see the fallacy in thinking that new money and credit could create more real demand. Real demand can come only from goods or services actually produced, which can in turn be exchanged for other goods and services. What's needed are more goods, not more claims on goods, i.e., money. More monetary demand will not genuinely put more people to work or spare capacity into use; but eliminating the artificial impediments causing this spare capacity will.[8] New money and credit will simply create a relative overproduction in some industries (e.g., real estate) relative to others.
An increase in money for the purposes of stimulating demand does not cause an increase in the production of real goods but only the appearance of such an increase. This appearance occurs through inflation and through the corresponding overinvestment in some industries — it gives the false appearance of an economic boom. Additional credit and inflation simply causes prices to increase as they adjust to the increased amount of money. The amount of real, physical goods stays the same.
The bottom line is that Japan has not needed new bank credit, or even much new real savings and capital, in order to prosper. It has just needed to maintain a sufficient proportion of capital (i.e., savings) allocation to efficient capital-goods production.
Summary
Despite conventional opinion, Japan's economy has not been stagnant; it has in fact been growing in real terms — although not in monetary terms. The crucial point is that monetary changes do not necessarily reflect real changes. Japan's GDP growth has been slow because money-supply growth has been slow; it is mainly money growth which drives GDP numbers. Therefore, going forward, we must try to observe real economic growth — the production of real goods and services — instead of just GDP. Seeing things in the correct light allows us to recoup Japan's lost decades, which weren't really lost.
Notes
[1] North's site requires a paid registration, but here are the articles he referenced: one by Darryl Gibson, and the other by James Fallows and Eamonn Fingleton.
[2] See G. Reisman, Capitalism: A Treatise on Economics (1996), p. 897, for a fuller demonstration. Most of the insights in this paper are derived from the high-level principles laid out by Reisman. For additional related insights on this topic, see Reisman, "The Stock Market, Profits, and Credit Expansion," "The Anatomy of Deflation," and "Monetary Reform."
[3] F. Machlup, The Stock Market, Credit, and Capital Formation (1940), p. 90.
[4] If there is any doubt that money or prices can be increased by any other means, please see George Reisman, Capitalism: A Treatise on Economics (1995), pp. 895–921. This exposition should put to rest any contrary arguments.
[5] This is not to say that the common assertion is that Japan's economy has been as dire as these two undeveloped countries; it's just to say that little or no growth is just that, and would be revealed as a rather flat line on a chart showing GDP per capita in dollars over time.
[6] Importantly, none of this is to say that I put a lot of faith in the accuracy of the charts I'm using, as inflation indices, price deflators, GDP calculations, and the very concept, data collection, and methodology of GDP itself is more than questionable. But I'm using the best formal data I can find; I'm analyzing on the terms used and provided by mainstream economists.
[7] This growth would require increases in technological progress, which would almost certainly be present in a growing economy, particularly because part of the capital investment would go specifically to creating new technologies.
[8] There will always be spare capacity for many reasons, not least of which is that businesses keep that spare capacity intentionally.
Kel Kelly has spent over 13 years as a Wall Street trader, a corporate finance analyst, and a research director for a Fortune 500 management consulting firm. Results of his financial analyses have been presented on CNBC Europe, and the online editions of CNN, Forbes, BusinessWeek, and the Wall Street Journal. Kel holds a degree in economics from the University of Tennessee, an MBA from the University of Hartford, and an MS in economics from Florida State University. He lives in Atlanta. Send him mail. See Kel Kelly's article archives.![]()
© 2011 Copyright Kel Kelly - All Rights Reserved Disclaimer: The above is a matter of opinion provided for general information purposes only and is not intended as investment advice. Information and analysis above are derived from sources and utilising methods believed to be reliable, but we cannot accept responsibility for any losses you may incur as a result of this analysis. Individuals should consult with their personal financial advisors.
© 2005-2022 http://www.MarketOracle.co.uk - The Market Oracle is a FREE Daily Financial Markets Analysis & Forecasting online publication.


