


Net Trade Deficits - A Leading Indicator of U.S. Economic Woes!
Economics / US Economy Apr 27, 2011 - 02:57 PM GMTBy: Ian_R_Campbell

 Many people think the root cause of the current U.S. economic problems is the sub-mortgage debacle. I certainly think that is a major contributor both to those problems, and to the timing of them. However, I believe (and have believed since 2005 when I first started to seriously study the U.S. and its evolving place in the world economic order) that what is happening now would have happened eventually absent the sub-prime crisis - albeit many years from now.
This is because I think an earlier principal driver in America’s economic malaise has to do with U.S. Federal Administrations dating back to 1971 (when President Nixon renounced Bretton Woods), and latterly dating back to 1990 and earlier when those Administrations embraced the concept of globalization - and hence indirectly the resultant movement of U.S. manufacturing jobs to ‘low wage’ countries. In simplistic terms, as I see things, globalization has had the effect of eliminating U.S. manufacturing jobs, while at the same time up to 2007 maintaining (or improving in many cases) the U.S. Main Street standard of living while concurrently keeping CPI inflation low. I believe measurements - and I think particularly important ones - of this manufacturing job replacement activity and U.S. dependence on imported oil are the U.S. monthly and cumulative net trade deficits. I have believed for some time that the U.S. net trade deficit is a significantly important monitor of the ongoing standing of the U.S. economy in the world order. I continue to believe that.
Each month the U.S. Government publishes the U.S. net trade deficit for the second prior month. On April 26 as I write this commentary, the latest month net trade deficit numbers that have been published are for February, 2011. The U.S. net trade deficit is the number derived by netting the typically positive (and comparatively small) U.S. ‘services trade surplus’ with the much larger U.S. negative ‘products trade deficit’. The ‘products trade deficit’ includes imported oil, so if the oil price goes up, typically so too does the U.S. net trade deficit. Currently, the U.S. net trade deficit runs at about U.S. $45 billion per month. Importantly, the U.S. has not had an annual net trade surplus since 1975.
The following chart shows the monthly U.S. net trade deficit for each of the twelve months ended February, 2011.

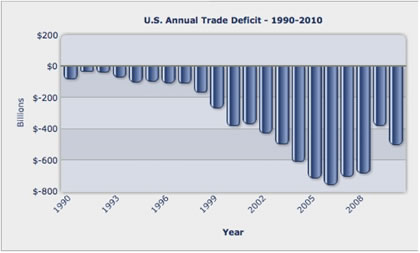
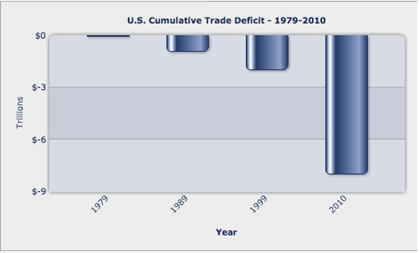
Frankly, I can’t think of two more interesting (and I think comparatively little focused on) charts than the two that follow. The first shows the annual U.S. net trade deficit from 1990 to 2010. The second shows the build-up of the cumulative U.S. net trade deficit from 1973, two years after Nixon renounced the Bretton Woods International Monetary System and gold as securitization for the U.S.$. If you have any interest at all in economic history, I suggest you watch a 4 minute video of that portion of a 1971 Richard Nixon speech where he made that announcement, and where he discussed how the changes he was announcing would protect American industry. I believe what you will watch and listen to is a 4 minute ‘turning point’ in U.S. history.
You might want to review and carefully think about the likely implications implied by these two charts, particularly the second one that shows the build in the U.S. Cumulative Net Trade Deficit from 1973 (when there wasn’t one) to December 31, 2010. Note that it took 26 years to the end of 1999 for the cumulative net trade deficit to reach U.S. $1.98 trillion, and that it quadrupled to U.S. $7.98 trillion in the 11 years ended 2010. At U.S. $45 billion per month, the U.S. cumulative net trade deficit currently continues to climb at a rate of in excess of U.S. $500 billion per annum - seemingly with no end in sight.
So what do these charts say to me? First as I see things they clearly show how the balance of world economic power has shifted, and continues to shift, away from the U.S. - particularly after 1999. Because I don’t see manufacturing jobs returning to the U.S. in a meaningful way, and because I see the U.S. as a net importer of oil for the foreseeable future, I don’t see the U.S. net trade deficits reversing and turning positive going forward. For me, assuming everything else equal, this means the U.S. economy weakens each month against the economies of its principal trading partners. Of course, everything else isn’t equal, as the U.S. goes significantly further into debt each passing day in the aftermath of its ongoing net trade deficits, U.S. manufacturing job losses, and the 2008 financial crisis - promulgated in part by the U.S. ongoing sub-prime mortgage debacle.
So where does all this end. I see things, nowhere good for any developed country overburdened with debt - including the one whose fiat currency for the time being at least continues to be looked at as the world’s benchmark (reserve) currency. Ah, but to be able to return to that fateful 1971 evening and watch the American Dream being played out on the ‘Leave it to Beaver’ television show - instead of watching President Nixon renounce Bretton Woods.
About Ian R. Campbell
Ian R. Campbell, FCA, FCBV, is a recognized Canadian business valuation authority who shares his perspective about the economy, mining and the oil & gas industry on each trading day. Ian is also the founder of Stock Research Portal, which provides stock market data, analysis and research on over 1,600 Mining and Oil & Gas Companies listed on the Toronto and Venture Exchanges. Ian can be contacted at icampbell@srddi.com
© 2011 Copyright Ian R. Campbell - All Rights Reserved
Disclaimer: The above is a matter of opinion provided for general information purposes only and is not intended as investment advice. Information and analysis above are derived from sources and utilising methods believed to be reliable, but we cannot accept responsibility for any losses you may incur as a result of this analysis. Individuals should consult with their personal financial advisors.
© 2005-2022 http://www.MarketOracle.co.uk - The Market Oracle is a FREE Daily Financial Markets Analysis & Forecasting online publication.