


Gold Jumping the Track Or Reaching a Routine Target?
Commodities / Gold and Silver 2011 May 02, 2011 - 01:40 AM GMTBy: Adam_Brochert

 When looking at longer time frames using technical analysis/charting, it is often appropriate to use a log scale price chart versus using a linear scale price chart for shorter-term time frames. But at what exact time frame should you switch from a log scale chart to a linear scale chart and what are the exceptions? Well, the answer is that we are dealing with art as much as science when using technical analysis.
But while doing my weekly exercise in charting the Gold universe, I found an interesting discrepancy in the Gold chart between its current price level and its prior speculative price peaks earlier in the secular Gold bull market. As an aside, the secular Gold bull market is far from over, so these are only short-term considerations. However, these charting issues could have quite profitable short-term implications for those riding the Golden bull.
Without further ado, here are the charts that have me intrigued. First, a log scale chart over the last 7 years of this Gold secular bull market ($GOLD) thru Friday's close:
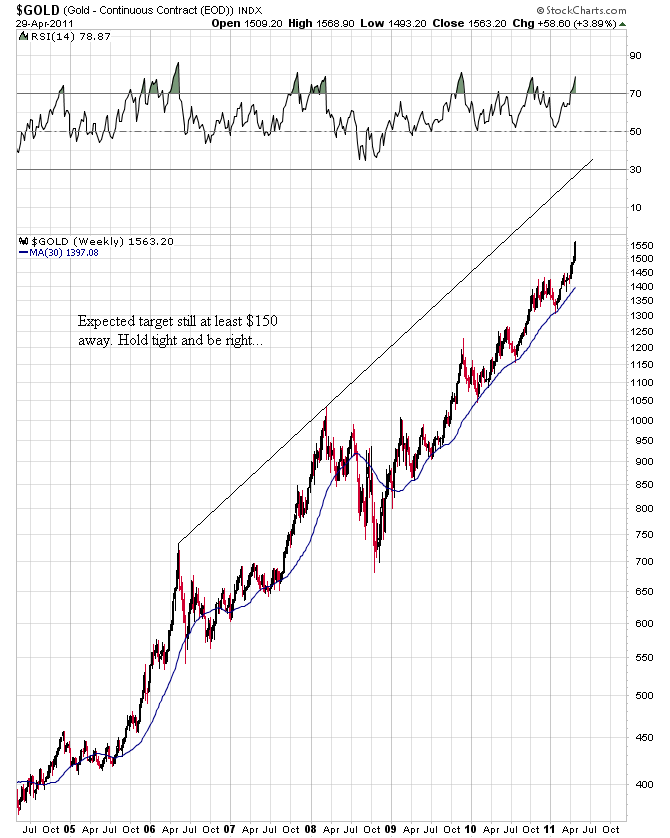
Great news and it means we have plenty of upside potential left for the current Gold run. However, the linear scale chart over the same 7 year period demonstrates an interesting and slightly different trend line situation:
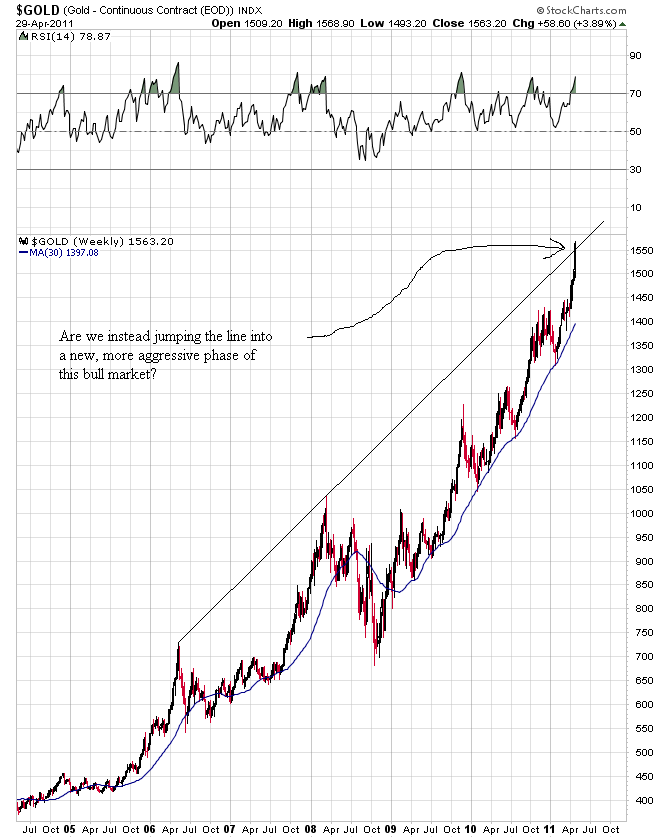
So, which chart is correct? Are we heading to a routine price target or jumping the shark and entering a more aggressive phase of the Gold bull market? The answer, I believe, is the latter. I base this partly on the recent action in silver, which has far outperformed Gold over the past year. Here is the linear scale chart of silver ($SILVER) over the same past seven years:
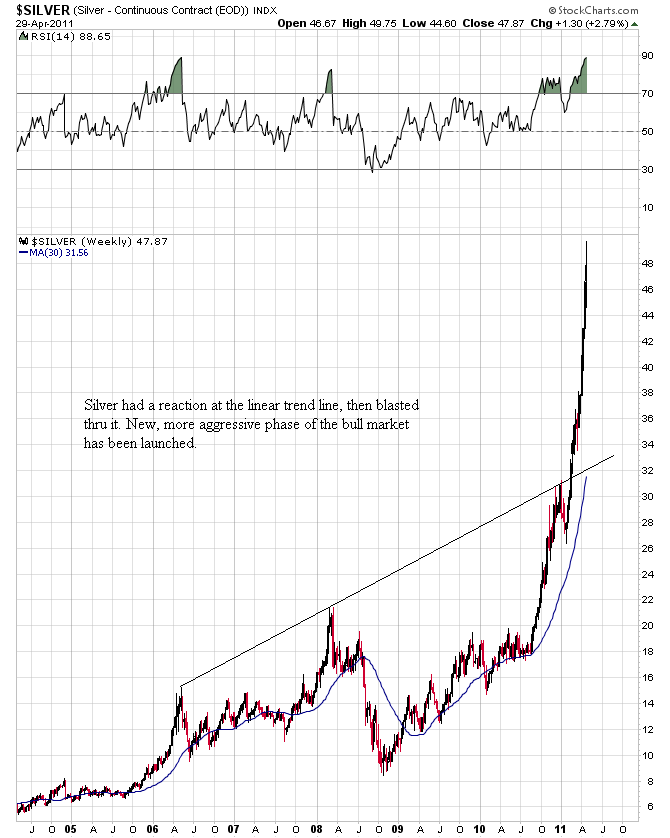
Obviously, silver is in a new linear trend, but it presumably would stop at it's log scale trend line - or would it? Here's the log scale chart of silver over the past 7 years:
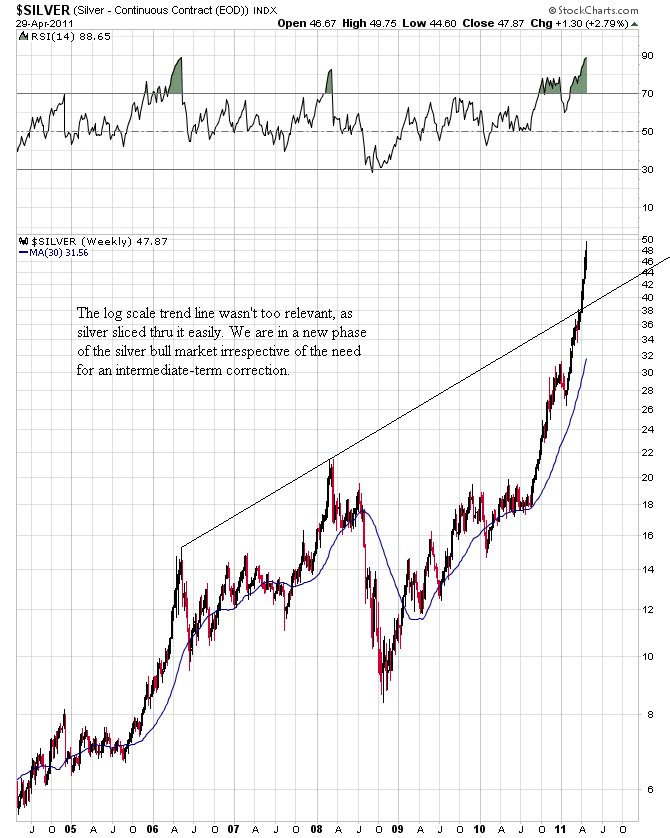
The "hot" money has made a boatload of cash in silver and there's likely still more to be made in this intermediate term run for the white metal. However, rotation of speculative money into Gold has likely begun and things could be just starting to heat up. As Sinclair has been saying, $1650 is in the bag for this run. However, could we also be looking at jumping the log scale trend line on this move like silver has done?
It certainly feels like the right time during this bull market in Gold for the transition to begin. The log scale trend line in Gold is likely to result in short-term profit taking as the linear scale trend line did in silver. However, I think it would be just another buying opportunity if it happened.
When the Dow to Gold ratio gets below 2, then I might consider starting to look around for other investment opportunities and selling some physical Gold. When I do sell some Gold, it will likely be in order to buy Gold stocks with the proceeds, which will likely peak after the Dow to Gold ratio bottoms (as they did in the previous two cycle nadirs in the Dow to Gold ratio). Until then, I'm just going to keep enjoying the ride in Gold.
Visit Adam Brochert’s blog: http://goldversuspaper.blogspot.com/
Adam Brochert
abrochert@yahoo.com
http://goldversuspaper.blogspot.com
BIO: Markets and cycles are my new hobby. I've seen the writing on the wall for the U.S. and the global economy and I am seeking financial salvation for myself (and anyone else who cares to listen) while Rome burns around us.
© 2010 Copyright Adam Brochert - All Rights Reserved
Disclaimer: The above is a matter of opinion provided for general information purposes only and is not intended as investment advice. Information and analysis above are derived from sources and utilising methods believed to be reliable, but we cannot accept responsibility for any losses you may incur as a result of this analysis. Individuals should consult with their personal financial advisors.
© 2005-2022 http://www.MarketOracle.co.uk - The Market Oracle is a FREE Daily Financial Markets Analysis & Forecasting online publication.