


Gold Falling to $1290 Suggests “Three Peaks and the Domed House” Pattern
Commodities / Gold and Silver 2011 May 04, 2011 - 02:25 AM GMTBy: Lorimer_Wilson

 Nu Yu, Ph. D with Lorimer Wilson writes: There are a number of different ways to look at what has been happening with the price of gold and silver of late and to anticipate what is next in store for this precious metal. One of the most unique ways of assessing past, present and future movement is by taking a look at the "Three Peaks and the Domed House" and "Bump and Run" chart pattern. Indeed, the "Three Peaks" pattern suggests that gold has peaked and will now decline by 17% to $1,290 per ozt. in June. Let me explain.
"Three Peaks and the Domed House" Pattern for Gold is saying...
My version of George Lindsay's basic model uses a macro or "phase-counting" approach which is different from Lindsay's classical micro approach (which uses "number-counting" from 1 to 28) in that it divides the "Three Peaks and the Domed House" pattern into five major phases as follows:
- Three Peaks
- Basement
- First Floor
- Roof
- Plunge
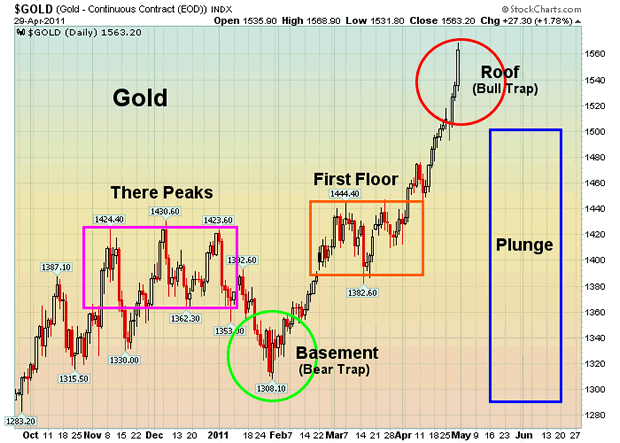
In the following chart with an intermediate-term time frame we can see that:
- the "Three Peaks" phase in gold developed from last November to last December
- the "Basement" phase (bear trap) formed in late January of this year when gold had a separating decline to reach a low at $1310 per ozt.*
- the "First Floor" phase of the Domed House was built in March after a rapid advance in the price of gold in February
- the "Roof" phase (bull trap) has been underway since early April with gold having overshot my target price of $1,540 which was a projection based on a measured move with the same length and duration as the advance move right before the "First Floor" phase.
- the "Plunge" phase has now begun and gold should experience a 17% decline to $1,290 per ozt. by the end of June.
*(For an explanation of what "ozt." means exactly please read this explanation.)
Please note that the "Three Peaks and the Domed House" pattern model will end with the "Plunge" phase and it has no future projection either in the upside or downside after the "Plunge" phase.
"Bump and Run Pattern" for Gold is saying...
As mentioned in my article in December here gold was forming, and is continuing to form, a Bump and Run pattern in a long-term timeframe which is shown in the weekly chart below. This pattern typically occurs when excessive speculation drives prices up steeply. According to Thomas Bulkowski, this pattern consists of three main phases:
-
A lead-in phase in which a lead-in trend line connecting the lows has a slope angle of about 30 degrees. Prices move in an orderly manner and the range of price oscillation defines the lead-in height between the lead-in trend line and the warning line which is parallel to the lead-in trend line.
-
bump phase where, after prices cross above the warning line, excessive speculation kicks in and the bump phase starts with fast rising prices following a sharp trend line slope with 45 degrees or more until prices reach a bump height with at least twice the lead-in height. Once the second parallel line gets crossed over, it serves as a sell line. Gold currently is in the bump phase, and its uptrend may continue as long as prices stay above the sell line.
-
A run phase in which prices break below the sell line often causing a bearish reversal to happen.
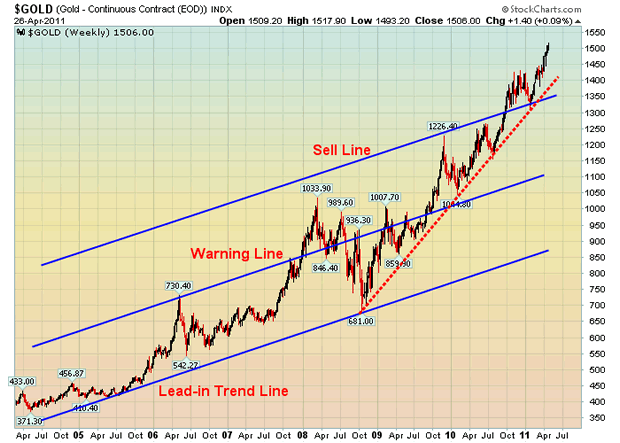
Looking at the current "bump-and-run" chart for gold above it is evident that gold is still very much a hold with its price well above the sell line at $1,350 per ozt..
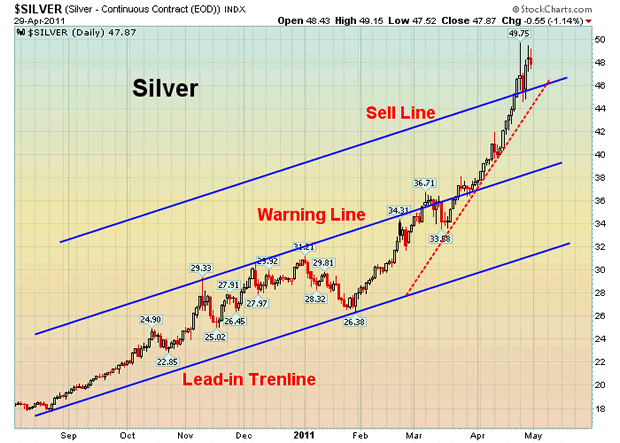
"Bump and Run Pattern" for Silver is saying...
When a price breaks below the sell line of a "run" phase it often causes a very bearish reversal to happen. Based on the current projection for the price of silver (see chart below) its sell line is near $46. With silver now trading below that level we could see silver correct down to the $39 level (i.e. -15%) and possibly go down to the $33 level (i.e. -28%) which would correspond to the "Plunge" phase of the gold index.
Conclusion
Many precious metals analysts (see here) are of the opinion that gold and silver prices are going to go parabolic in the months and years ahead. My analyses suggest, however, that at least short term, both gold and silver run the risk of experiencing major corrections along the way.
Please Note: Don't forget to sign up for munKNEE’s FREE weekly "Top 100 Stock Market, Asset Ratio & Economic Indicators in Review"
Dr. Nu Yu (fx5186.wordpress.com/), co-founder and president of Numarkan Investments and an affiliate of the Market Technician Association, is a frequent contributor to www.munKNEE.com
Visit http://www.FinancialArticleSummariesToday.com, “A site/sight for sore eyes and inquisitive minds”, and www.munKNEE.com, “It’s all about MONEY”, where you can sign up for their FREE weekly "Top 100 Stock Market, Asset Ratio & Economic Indicators in Review."
© 2011 Copyright Dr. Nu Yu - All Rights Reserved
Disclaimer: The above is a matter of opinion provided for general information purposes only and is not intended as investment advice. Information and analysis above are derived from sources and utilising methods believed to be reliable, but we cannot accept responsibility for any losses you may incur as a result of this analysis. Individuals should consult with their personal financial advisors.
© 2005-2022 http://www.MarketOracle.co.uk - The Market Oracle is a FREE Daily Financial Markets Analysis & Forecasting online publication.