How to Trade Silver Options for BIG Profits
InvestorEducation / Options & Warrants May 14, 2011 - 07:55 AM GMTBy: J_W_Jones
 Hi-Yo Silver, Away, Last week silver was the focus of incredible price swings which left many licking their wounds and shaking their heads at the trading losses they had incurred. This sell off was likely triggered by the increase in margin requirements for futures contracts, but the stunning price decline extended to all vehicles like exchange traded funds use to trade the glimmering metal.
I recognized the potential opportunity early in the week, and began to look at various position structures using options on Tuesday morning. In order to understand the thinking behind this trade, it is necessary to understand the concept of implied volatility of an option contract. Implied volatility, together with time to expiration and price of the underlying security, form the three primal forces that rule the world of option pricing. This measure of volatility is best described as the collective opinion of traders as to the future volatility of the price of the underlying. Implied volatility is the variable which determines if options are priced cheap or overvalued.
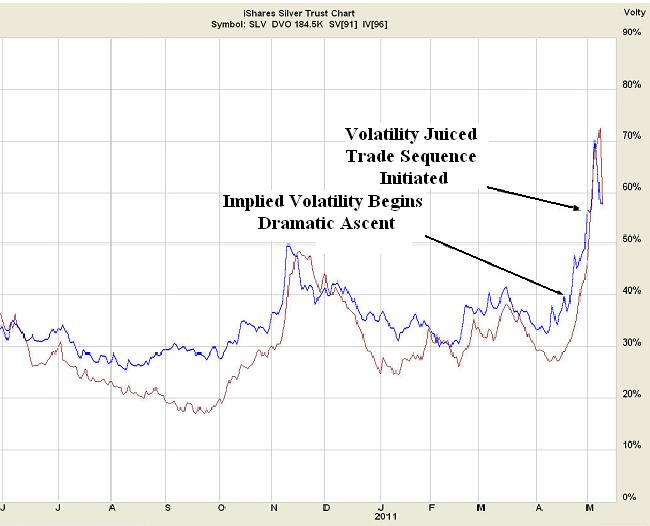
One of the fundamental behavioral characteristics of options is the reaction of implied volatility to rapid price change. As a general rule, implied volatility goes down as the price of the underlying increases and vise-versa. Another functional characteristic is that it tends to revert to its historic mean once rapid price movements have moderated and actual price volatility returns to its historic range. The chart below is from a historical database of SLV implied volatility. Note the dramatic rise, indicated by the blue line, beginning in mid April and reaching historically unprecedented levels in early May.

Books have been written to describe details of various option trade structures, and a discussion of all potentially useful strategies is beyond the scope of my mission today. Suffice it to say that individual trades can be structured to respond either positively or negatively to reductions in implied volatility. Given the extremely elevated state of the SLV implied volatility, which side would you want to take? Hint: Volatility doesn’t remain elevated forever. A well-established characteristic of implied volatility is its tendency to revert to its historic mean.
The trade structure I chose to use was that of a calendar spread. This two legged spread is constructed by selling a short dated option and buying a longer dated option. The options
selected to construct each spread are at the same strike price and are of the same class, either puts or calls. Maximum profit of each spread occurs at expiration of the shorter dated option when the price of the underlying is at the strike price of the spread. The main profit engine for this spread is the more rapid time decay of option premium in the shorter dated option relative to the longer dated option.
My trade plan was to buy the May monthly option series which had 18 days of life remaining and sell the weekly options, an option series with only 4 days of life remaining when the trade sequence was started. An essential part of my plan was to adjust the spread as required by price movement to keep in the profit zone of the P&L curve.
It is important to recognize the “secret ingredient” of the spread that put the wind at my back; this special ingredient was the much greater implied volatility of the option I was selling compared to the option I was buying. In the language of the option trader, this situation is termed a positive “volatility skew”. This positive volatility skew increases our odd of success because we are selling a richly priced option and buying a more reasonably priced option; the old adage of “buy low, sell high” applies to volatility as well as price.
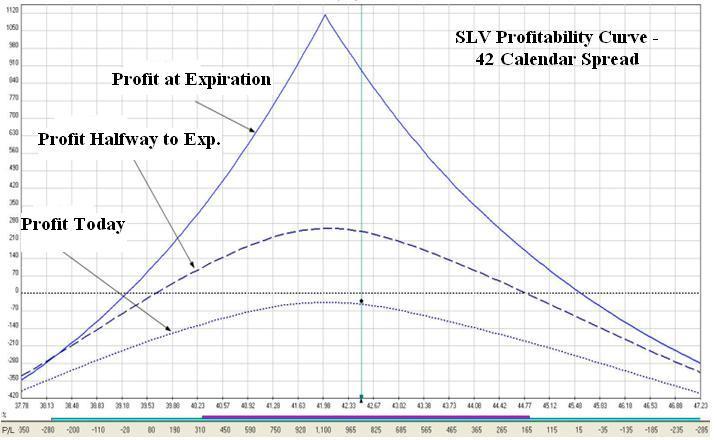
The trade that I will discuss began mid-morning on Tuesday, May 3 when SLV was trading around $42.50. My opening traded was to establish the calendar spread at the 42 strike, in options peak, this is known as an at-the-money calendar spread. The opening trade is displayed below:

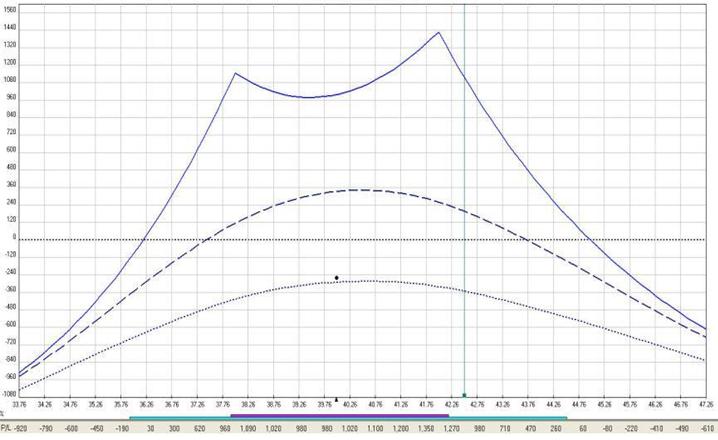
Price continued to decline for the next several hours and by mid afternoon, SLV was trading around $40. This rapid decline was beginning to approach my lower breakeven price point at $39.24 and I felt I needed more room to allow for price action movement. At this point I chose to add an additional calendar spread at the 38 strike using puts to create a double calendar spread. The resulting trade lowered my breakeven point on the low side from the original $39.24 to $36.21. The new spread’s profitability curve is graphed below:

Price action the next day, Wednesday May 4, was a bit more subdued, and price remained within my profitable zone. Time decay of the short option premium was accelerating and no further action was required. All systems were “go”.
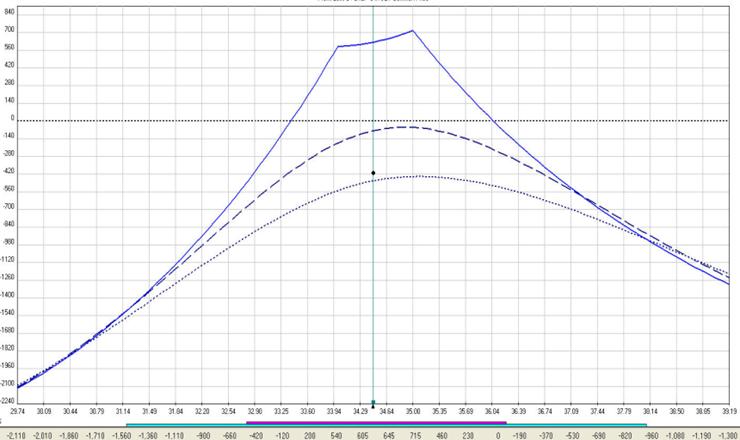
The following day, Thursday May 5, price movement resumed its rapid decline and price had moved beyond the profitable zone of our double calendar spread. Action was required; “wishing and hoping” in these situations is strictly not allowed The original position needed to
be modified in order to re-establish a new zone of profitability surrounding the current price of SLV. Because SLV had moved well below the lower breakeven point of the double calendar, radical surgery was necessary. I chose to remove the entire position and re-center the spread. I closed both the 42 call calendar and the 38 put calendar and bought 2 put calendars at the 34 and 35 strikes. As Thursday ended, I had the position illustrated below:

Price movement during the next day, Friday, remained within the range of $33.60 to $35.57. These price extremes for the day were within our limits of profitability of the new double calendar. I closed the spread by mid afternoon when the time premium of the options I had sold short had largely eroded.
This trade had a profit of 15.9% net of commissions for trade duration of approximately 72 hours. I think the lesson to be learned from this trade is that a knowledgeable option trader can survive and prosper in a variety of market conditions. This demonstration is, I think, an example of the tremendous power of options to mitigate risk and provide controlled risk trading opportunities in fast moving markets.
This trade has been part of a strong period of performance for members at OptionsTradingSignals.com. Recent performance has been outstanding as 6 out of 7 trades have produced profits while the final trade remains open. The following returns are based on trade entry and executions. Commissions have not been factored in as option commission structures are different and members may have received a better or worse trade execution. With that said, the gross returns are listed below:
GLD Call Calendar Converted To Vertical Spread – 58%
RUT Call Calendar Spread – 12%
SPY Call Vertical Spread – 32%
SLV Call Calendar Spread Converted to Double Calendar Spread – 18%
AMZN Call Calendar Spread – 37%
SLV Call Calendar Spread Discussed Above – 20%
The cumulative return of the most recent 6 trades is 177%. Obviously the recent track record has been strong and the overall return for members would differ based on position size, risk tolerance, and account size. Since the beginning of the service in December, the overall win / loss record is 14 winning trades, 1 breakeven trade, and 8 losing trades. The overall successful trade percentage based on the trades that have been closed is just shy of 61%. In full disclosure, two trades remain open at this time.
Recently I have used a lot of calendar spreads due to the low volatility environment we have been trading in. The trade constructions that I use adjust based on volatility levels of underlying assets and the VIX index in general. Essentially the service does not use the same trades over and over unless the volatility environment is little changed. Recently we have had consistently low volatility levels and calendar spreads have been attractive. In the future, volatility levels will likely change and other trade constructions would be warranted at that time.
The special offer currently being presented to new members is an extreme value. Most long term members have pointed out that they would be willing to subscribe just for the daily technical analysis provided as well as the 2 – 3 weekly videos that members receive that contain technical analysis of key indices, futures, and ETF’s. My primary focus is to deliver value to members beyond just solid trade management and performance.
I am focused on performance, but my greatest thrill is watching novice option traders start to learn how to trade options in spreads effectively and for consistent profits. Options are one of the most overlooked trading tools in financial markets and the power they offer individual investors is consistently overlooked. Options are more than just hedging tools; they offer individual investors the power to diversify away from standard assets.
Get My Trade Ideas Here: http://www.optionstradingsignals.com/profitable-options-solutions.php
J.W. Jones is an independent options trader using multiple forms of analysis to guide his option trading strategies. Jones has an extensive background in portfolio analysis and analytics as well as risk analysis. J.W. strives to reach traders that are missing opportunities trading options and commits to writing content which is not only educational, but entertaining as well. Regular readers will develop the knowledge and skills to trade options competently over time. Jones focuses on writing spreads in situations where risk is clearly defined and high potential returns can be realized.
This article is intended solely for information purposes. The opinions are those of the author only. Please conduct further research and consult your financial advisor before making any investment/trading decision. No responsibility can be accepted for losses that may result as a consequence of trading on the basis of this analysis.
© 2005-2022 http://www.MarketOracle.co.uk - The Market Oracle is a FREE Daily Financial Markets Analysis & Forecasting online publication.


