Stock Market One More Push Higher Before Correction Sets In
Stock-Markets / Stock Markets 2011 May 16, 2011 - 05:27 AM GMTBy: Andre_Gratian
 Very Long-term trend - The continuing strength in the indices is causing me to question whether we are in a secular bear market or two consecutive cyclical bull/bear cycles. In any case, the very-long-term cycles are down and, if they make their lows when expected, there will be another steep and prolonged decline into 2014-16.
Long-term trend - In March 2009, the SPX began a move which evolved in a bull market. Cycles point to a continuation of this trend for several more months.
SPX: Intermediate trend - The intermediate trend is still up. After the 1370 projection was reached, the SPX started a normal consolidation pattern which is ongoing, but nearly complete. The intermediate uptrend is expected to resume afterwards.
Analysis of the short-term trend is done on a daily basis with the help of hourly charts. It is an important adjunct to the analysis of daily and weekly charts which discusses the course of longer market trends.
Market Overview
After reaching its 1370 projection, the SPX started a consolidation process -- which is normal. The stock market progresses through a process of accumulation-uptrends, distribution-downtrends, which repeats itself continuously in various degrees over various time frames. Elliott came to the same conclusion when he identified corrective and impulse patterns as the basic frame work of the market. Point & Figure charts give us a much clearer picture of this process than bar charts. In addition, they have the capacity to tell us how much energy is stored in these accumulation and distribution phases, and how far the following move is likely to carry.
Based on a conservative count taken across the 2009 base, the top of the bull market could be as low as 1365, or substantially higher if the liberal count prevails.
Since the index has already reached 1370, we know that the conservative count has been filled, and that we could be at a bull market top. Are we done? Probably not! As the trend develops, there are periods of consolidation which are known as re-accumulation or re-distribution phases that are very helpful at projecting the extent of the next move. Several of these past patterns point to another push higher before we get to the end of the current intermediate trend. I am going to assume that they are correct and that the consolidation which is underway is only a precursor of the next uptrend.
Let's go to the charts and see if we can find some justification for this premise.
Chart Analysis
One thing which I forgot to mention when we looked at the SPX Weekly Chart last week was the condition of the oscillator. Based on that alone, we could surmise that a top has been reached and that we are about to start a severe correction. We can keep it in the back of our minds as we analyze other aspects of the market to see if we have confirmation, or if a bullish stance is still warranted.
We'll begin with the Daily Chart and go directly to the oscillators. The top one confirms the weekly, but the bottom one does not. If they both told the same story, I would be more concerned. As it stands, the A/D indicator is neutral-positive. Also note that the top oscillator was very overbought when the SPX touched 1370 and showed no negative divergence before rolling over. If (when?) the index goes to a new high, it should show some negative divergence and signal the end of the move from 1249.
The price chart is still in a clear uptrend, trading above its blue intermediate channel and substantially above the 200-DMA as well as the bottom of its long-term channel. This is not the picture that you usually get at a market top. This tells me that: 1) the top of the intermediate trend from 1011 has not yet been reached, and that 2) since we are likely to surpass the conservative bull market count of 1365-70, we should begin to pay attention to the liberal count. We are first likely to have an intermediate correction, and then finally rise into the bull market high. This could take us into 2012.

If there is another up-move before the end of the intermediate trend, it means that we must be making a corrective pattern. We can see it much more clearly on the Hourly Chart.
1370 was the top of the second phase from 1249 and the level from which the correction started. My modicum of Elliott Wave knowledge tells me that we are in a corrective pattern (which is either a flat or a triangle) that will require a few more days to complete. I have all sorts of channels drawn on this chart to identify the various trends. The main channel of the correction is outlined in light red and the "c" wave in black. The trend line from 1249 is green, and the channel from 1249 is bordered in gray. The letter "c" on the chart is not intended to pin-point either price or time. It will not matter if the green trend line is broken, and it is possible that we could decline all the way down to fill the (light blue) gap, but we will probably remain within the boundaries of the gray channel. When the correction is over, I would expect to start phase #3 with a bang!
The indicators tend to support this analysis. They are not in a position to give an immediate buy signal and may have to show some positive divergence just before they do.

Projections
I WILL NO LONGER GIVE SPECIFIC PROJECTIONS FOR THE SPX IN THE WEEKLY REPORTS, RESERVING THOSE FOR SUBSCRIBERS.
Cycles
There are a number of near-term cycles which are indicated on the daily chart. Probably the most reliable one is marked with the black asterisk and signals a potential high. If does not mean that it will bring about a correction of equal degree to those of the recent past, but it could make its presence felt, because it is followed by a 13-wk cycle the following week.
I have not followed the Armstrong cycles very closely, lately. But considering that we should be in an uptrend, it could signal that the top of phase #3 will occur on about 6/13.
Breadth
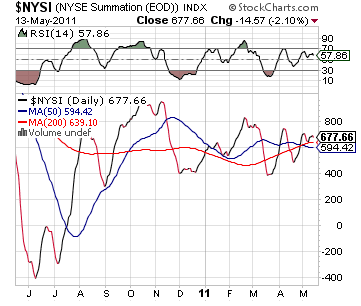
The NYSE Summation Index (courtesy of StockCharts.com) has shown a pretty neutral reading in the past month. It is not indicating immediate weakness for the market.

Sentiment
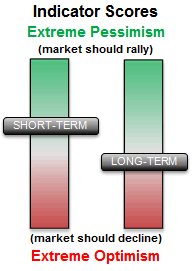
The long-term SentimenTrader (courtesy of same), is not yet at a dangerous level for the market. This supports the view that we should move higher before finding an intermediate top.
Furthermore, the short-term index is signaling a potential short-term low, warning of the approaching end of the small down wave in the SPX.

I have created my own leading indicator. It consists of a group of 6 indices and stocks which have consistently predicted a turn in the equity markets. All six components are currently bearish, warning of continued short-term weakness. I follow them on a 60m chart.
Dollar index
The respective projections for the dollar and UUP came out slightly differently. The dollar went one point below its 74 projection before finding terra firma, while UUP met its 21 target exactly.
The index has had a good rally over the past two weeks but it should soon come to the end of its initial break-out move and begin building a base. A .382 retracement of the last wave down would take it to about 21.80. This may be the extent of the move for now.

Gold
Gold, as expected, did the reverse of the dollar. After reaching its 153-54 projection (the high was 153.61), GLD had a dramatic three-day reversal which took it down eleven points. But that's only about a 7% loss. Silver, on the other hand, has continued down for the past two weeks, and lost a hefty 33% of its value.
Below, I show a weekly chart of GLD. The quick, sharp correction does not look very significant on this scale, and it is clear that there were far more speculators in silver than in gold. Nevertheless, even though GLD has already recovered exactly fifty percent of its loss, this looks like the beginning of a more substantial correction -- perhaps one of intermediate nature.
The first support level is obvious. The price may find it difficult to penetrate very far below 139 right away, especially since it is in the vicinity of the 2+-year trend line. But it's not inconceivable that the long-term trend line will be broken. It depends on how much of a rally the dollar can muster, and how serious the approaching intermediate correction in equities will be. We will know more precisely what to expect when the top formation has been completed and a P&F projection can be made.

Oil

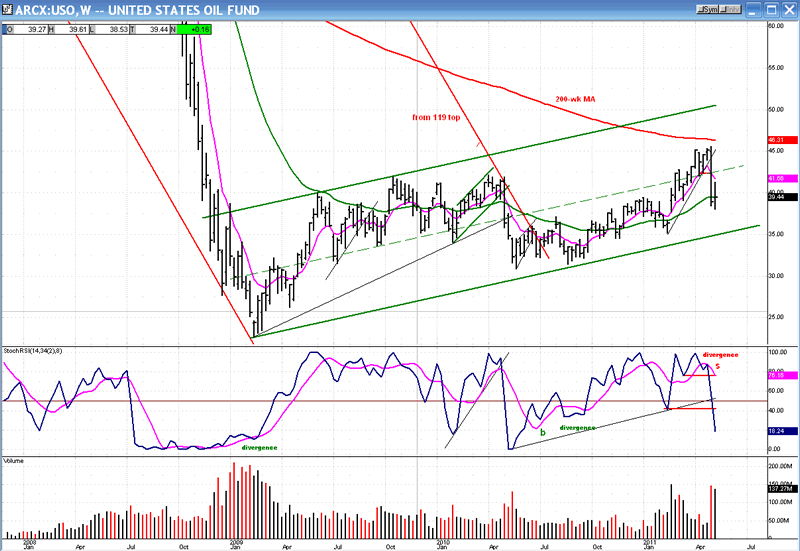
Above, is a weekly chart of USO, the oil ETF. It, too, suffered an instantaneous set-back after reaching its 46 projection. So far, it has dropped about 17% from its high but, like GLD, it looks like only the start of a deeper correction, probably of intermediate nature. It may find support on its main trend line, around 35. If the current ratio holds, it would correspond to WTIC declining to around 89. That closely matches the P&F projection for the correction low in WTIC.
Summary
The SPX is consolidating after reaching its phase projection of 1370. While there is a minimal chance that this could turn out to be an important top, the odds favor one more push to a new high before an intermediate correction sets in, with the eventual top of the bull market at a much higher level.
Note: I have started to follow TLT closely. I find it to be a valuable addition to the VIX as a predictor of SPX reversals. Both TLT and VIX are part of my leading indicator index. Specific signals generated by TLT and this indicator will only be discussed with subscribers.
FREE TRIAL SUBSCRIPTON
If precision in market timing for all time frames is something which is important to you, you should consider a trial subscription to my service. It is free, and you will have four weeks to evaluate its worth.
For a FREE 4-week trial. Send an email to: ajg@cybertrails.com
For further subscription options, payment plans, and for important general information, I encourage you to visit my website at www.marketurningpoints.com. It contains summaries of my background, my investment and trading strategies and my unique method of intra-day communication with Market Turning Points subscribers.
By Andre Gratian
MarketTurningPoints.com
A market advisory service should be evaluated on the basis of its forecasting accuracy and cost. At $25.00 per month, this service is probably the best all-around value. Two areas of analysis that are unmatched anywhere else -- cycles (from 2.5-wk to 18-years and longer) and accurate, coordinated Point & Figure and Fibonacci projections -- are combined with other methodologies to bring you weekly reports and frequent daily updates.
“By the Law of Periodical Repetition, everything which has happened once must happen again, and again, and again -- and not capriciously, but at regular periods, and each thing in its own period, not another’s, and each obeying its own law … The same Nature which delights in periodical repetition in the sky is the Nature which orders the affairs of the earth. Let us not underrate the value of that hint.” -- Mark Twain
You may also want to visit the Market Turning Points website to familiarize yourself with my philosophy and strategy.www.marketurningpoints.com
Disclaimer - The above comments about the financial markets are based purely on what I consider to be sound technical analysis principles uncompromised by fundamental considerations. They represent my own opinion and are not meant to be construed as trading or investment advice, but are offered as an analytical point of view which might be of interest to those who follow stock market cycles and technical analysis.
Andre Gratian Archive |
© 2005-2022 http://www.MarketOracle.co.uk - The Market Oracle is a FREE Daily Financial Markets Analysis & Forecasting online publication.


