


U.S. Treasury Bond Market Forecast, Inflation Is In The Heir
Interest-Rates / US Bonds May 18, 2011 - 01:08 PM GMTBy: David_Petch

 Ah, it is May, the snow has recessed to uncover nature waiting to beam with green radiance. Spring is in the air. On the same note, financial shenanigans of yesteryear are finally starting to come home to show inflation...inflation is in the air just as noticeably. This article is going to focus on "Inflation is in the Heir". Barrack Obama is a very intelligence speaker, intelligent and possess charisma. However, they could have Mickey Mouse or the Pope as the US President, or any other nation for that matter and there is nothing that can be done to prevent the coming inflationary wave...it is all part of a very long economic cycle.
Back in 1913 after intense hard times and the Federal Reserve was created by a weekend getaway to Jekyll Island. And that is a brief history of the Federal Reserve. Implementation of the Federal Reserve started the erosion process of gold-backed currencies. Gradual bastardization of this system lead to speculative fervour that aided in creating the crash of 1929. During this time was when Kenysian economics was born. In order to devalue the US dollar, Roosevelt ordered confiscation of gold from all US citizens at $20/ounce. After all the gold was taken, the price was raised to $35/ounce, thereby boosting the amount of money in the US government coffers.
Near the end of World War II, plans were created for trying to slowly rebuild global countries around the world and hence, the Bretton Woods System was created. Gold was fixed at $35/ounce until 1971 when silent inflation was pressing and France was demanding the US to repay their debt in gold. Because of this push, Nixon took the US dollar of f the gold standard and was allowed to trade freely. With this move the US was able to print money freely to cover bills without having to work for it. This policy soon swept the globe and inflation ran rampant until 1979 when gold closed briefly above $850/ounce.
Subsequent to the commodity top, all cycles that top must bottom and it took over 30 years for interest rates to bottom. Inflation in North America was deferred by the US dollar being stronger than most currencies, which allowed imported goods to be purchased cheaper. While North Americans and Europeans bought cheap goods from China and Asia, they saved and slowly accumulated money. Now, as with any insight into history, those that save will have power. Workers in China have demanded more money and since the Chinese Yuan is linked to the US dollar, any increases in price due to monetary expansion in the US will be passed onto the Chinese populous. When China removes its peg to the USD and trades freely, it will rise in value, which will in turn make things cheaper for them as a nation. The long-term losers will be Europe and North America as prices will rise substantially. This is what has been talked about for years as "Sooner or later the chickens will come home to roost".
Silent inflation has been building for 30 years and now is really going to hit everyone hard. Push inflation is not possible, because if unions demand too much money, companies will shut down or go somewhere else. Interest rates are low right now, but what will push them will be people demanding more return for their money due to increases in defaults. Rates are likely to rise over the next 8-10 years...the start of rising rates is at its infancy. When interest rates rise, there is a rush into tangible assets. With the introduction of tax-free savings accounts in Canada, things like this are the best ways to participate in the coming rise in gold and silver prices.
The above is a very condensed version of history from 1913 till present and how we got here. This is a very long economic cycle. Cycles are in nature, just like the Earth rotates around the sun or the moon goes around the Earth. In order to pass through this difficult period of time, we must allow the time to pass. Intervention into trying and stopping the cycle or stretching it out will only make matters worse.
The accompanying graphs for this article examine the 10 Year US Treasury Index and describe the likely trend to occur over the next 8-10 years. I cover the US dollar weekly and will leave analysis and discussion about it for another day.
10 Year US Treasury Index
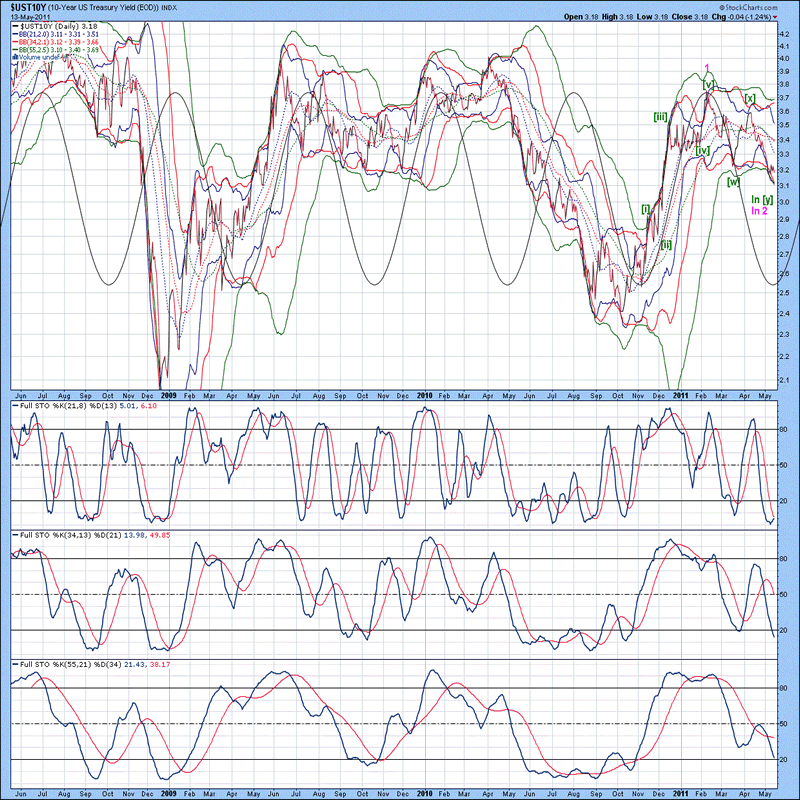
The daily chart of the TNX is shown below, with all three lower Bollinger bands beneath the index, suggestive that a bottom is being put in place. Full stochastics 1, 2 and 3 are shown below in order of descent, with the %K beneath the %D in all three instances. The %K in stochastic 1 appears set to cross above the %D, however, the %K in stochastic 2 is at least 2-3 weeks away from doing this. An oscillator function new to Stockcharts was included in this graph to illustrate the time taken for wave 1 of the Elliott Wave count. Wave 2 is nearing completion, but based upon stochastics, a bottom is not due for another 2-3 weeks. What is important to recognize that a change in trend since November 2010 has been underway. Waves 3, 4 and 5 have yet to occur and is likely to complete sometime between June and December 2012, with an expected top to lie somewhere between 5.2-5.4%. Wave (2) down after wave (1) completes will take 18-24 months to complete, which will coincide with a sharp downward move in the broad stock market indices (A 40-50% retracement from highs of 1600-1650 expected in late to mid 2012).
Figure 1
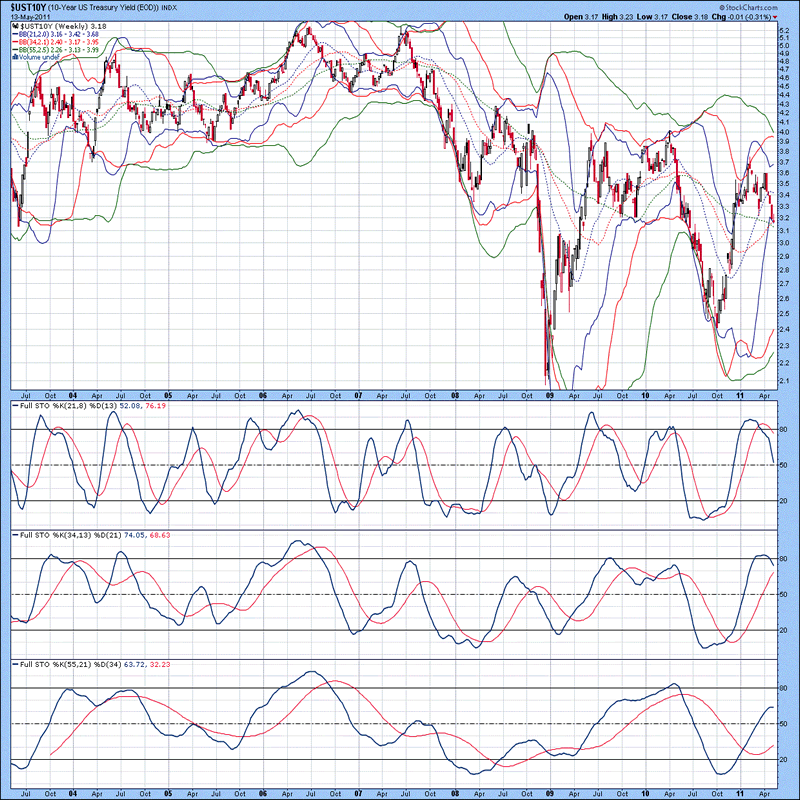
The weekly chart of the TNX is shown below, with lower 34 and MA Bollinger bands well beneath the index, suggestive that the minimum 2-3 weeks for a bottom based upon Figure 1 could become extended for 2-3 months. Full stochastics 1, 2 and 3 are shown below in order of descent, with the %K beneath the %D in 1 and above the %D in 2 and 3. Based upon positioning of the %K in stochastics 1 and 2, wave 2 as per Figure 1 might not be complete for another 2-3 months. This sort of time frame correlates well with the expected termination point of wave (1) in the latter part of 2012/early 2013. The important item to take home from this observation is that if wave (1) takes 24-26 months, wave (2) will take at least as long, maybe longer. Then, waves (3), (4) and (5) will have yet to form which takes this impulsive bull market into 2021-2022 time frame. As I have stated before, the bull market in precious metals is just beginning. Rising interest rates spur a demand for investments in tangible items, since this is the only way to preserve capital. When the top does arrive, those that time things well by exiting and purchasing other stocks at depressed levels will stand to make fortunes.
Figure 2
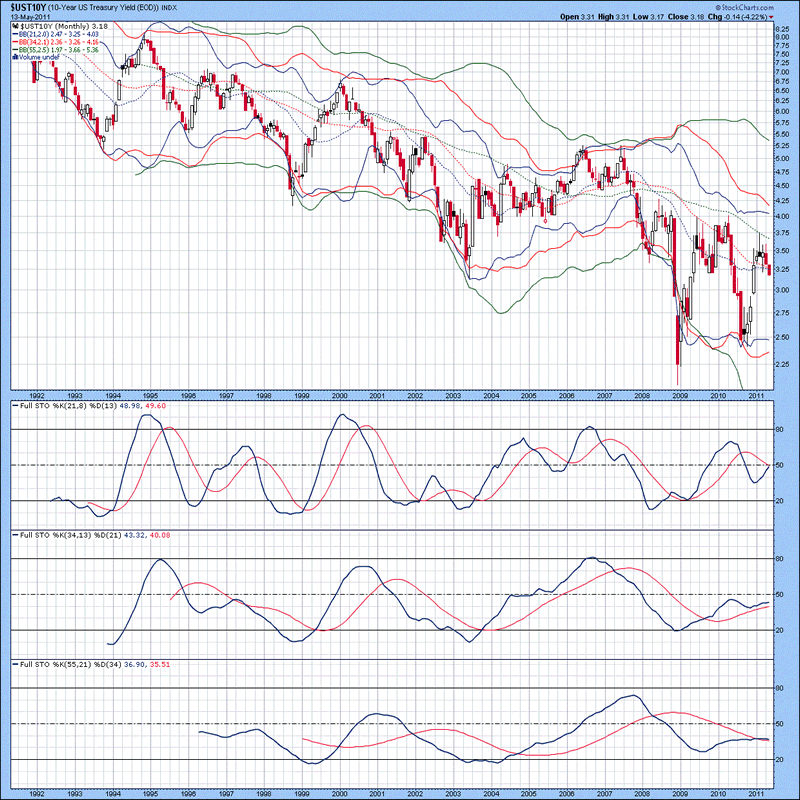
The monthly chart of the TNX is shown below, with lower Bollinger bands beneath the index, suggestive that a bottom was put in place back in 2009. Full stochastics 1, 2 and 3 are shown below in order of descent, with the %K beneath the %D in 1 and above the %D in 2 and 3. Notice how the %K in stochastic 1 curled up...this suggests the TNX is in a multi-year uptrend. Rising interest rates basically imply that bank accounts are not the place to store money as purchasing power will erode on a yearly basis, compounding. So, the only really smart things to do with money over the coming years is to pay down debt, buy gold and silver bullion or equities in favourable resource companies...tangible asset allocation is the only way to really preserve capital and have it grow over the coming years. Bond investors will get smashed when the trend defined in these Figures becomes "visible" to the street. This will start a rush into gold and silver bullion which is what will make stocks go to the moon. If stocks behave like 1980-1986, there is no telling how high prices could go. The general public is still not on board at all, so this speaks volumes.
Figure 3
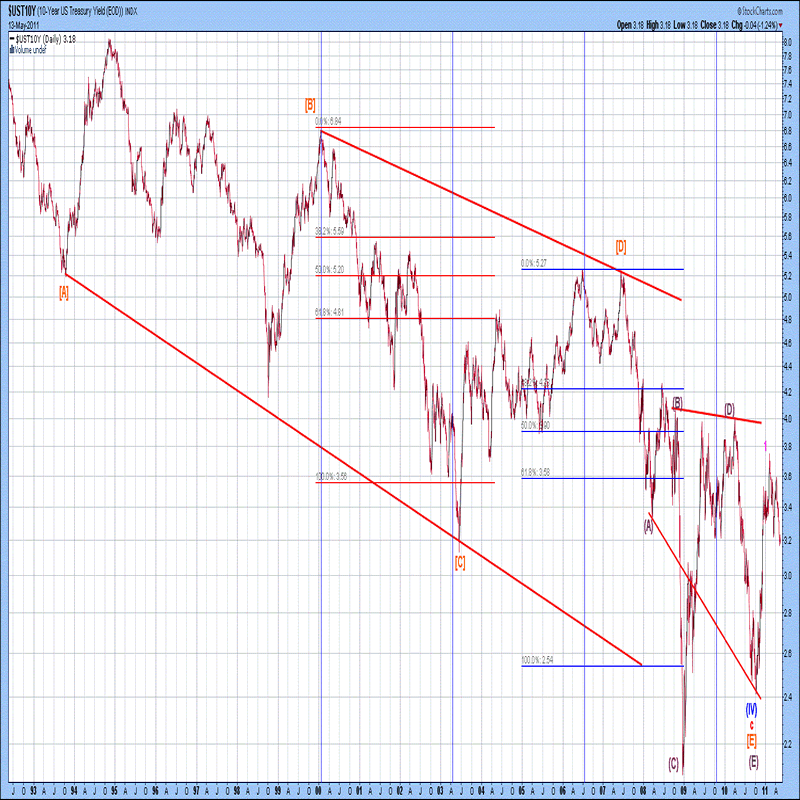
The long-term Elliott Wave count of the TNX is shown below, with wave 2 underway at present. The decline from 1980 till 2010 was 30 years, which has yet to confirm a breakout of the downtrend line. When this happens later in 2012 and then back and fills the breakout in wave (2) from 2013-2014, expect everyone to be calling deflation...this will be anything from the truth. This will represent a "pause" or "breath" in the cycle pattern before it breaks to new highs in 2014 and beyond. I have wrote numerous articles in the past, "Diatribes of a Deflationist" etc. so there is no point rehashing explanations of the past. The ability for governments to control currency growth by printing money and forcing it into circulation by offering to banks, who in turn further inflate the money base through fractional reserve practices has been the main way money has entered the system. Governments in countries like the US, Canada, Australia etc. are becoming more and more government-based economies, which is how money is being syphoned into the economy...make work projects, more jobs etc. etc. The chickens are going to come home and roost for every nation...just think about how expensive things for the US will become once China is forced (due to internal inflation problems) to decouple their Yuan from the US dollar and allow it to trade freely.
Figure 4
That is all for today. Back tomorrow with an update of the USD index and 3 currencies. Have a great day.
By David Petch
http://www.treasurechests.info
I generally try to write at least one editorial per week, although typically not as long as this one. At www.treasurechests.info , once per week (with updates if required), I track the Amex Gold BUGS Index, AMEX Oil Index, US Dollar Index, 10 Year US Treasury Index and the S&P 500 Index using various forms of technical analysis, including Elliott Wave. Captain Hook the site proprietor writes 2-3 articles per week on the “big picture” by tying in recent market action with numerous index ratios, money supply, COT positions etc. We also cover some 60 plus stocks in the precious metals, energy and base metals categories (with a focus on stocks around our provinces).
With the above being just one example of how we go about identifying value for investors, if this is the kind of analysis you are looking for we invite you to visit our site and discover more about how our service can further aid in achieving your financial goals. In this regard, whether it's top down macro-analysis designed to assist in opinion shaping and investment policy, or analysis on specific opportunities in the precious metals and energy sectors believed to possess exceptional value, like mindedly at Treasure Chests we in turn strive to provide the best value possible. So again, pay us a visit and discover why a small investment on your part could pay you handsome rewards in the not too distant future.
And of course if you have any questions, comments, or criticisms regarding the above, please feel free to drop us a line . We very much enjoy hearing from you on these items.
Disclaimer: The above is a matter of opinion and is not intended as investment advice. Information and analysis above are derived from sources and utilizing methods believed reliable, but we cannot accept responsibility for any trading losses you may incur as a result of this analysis. Comments within the text should not be construed as specific recommendations to buy or sell securities. Individuals should consult with their broker and personal financial advisors before engaging in any trading activities as we are not registered brokers or advisors. Certain statements included herein may constitute "forward-looking statements" with the meaning of certain securities legislative measures. Such forward-looking statements involve known and unknown risks, uncertainties and other factors that may cause the actual results, performance or achievements of the above mentioned companies, and / or industry results, to be materially different from any future results, performance or achievements expressed or implied by such forward-looking statements. Do your own due diligence.
Copyright © 2011 treasurechests.info Inc. All rights reserved.
Unless otherwise indicated, all materials on these pages are copyrighted by treasurechests.info Inc. No part of these pages, either text or image may be used for any purpose other than personal use. Therefore, reproduction, modification, storage in a retrieval system or retransmission, in any form or by any means, electronic, mechanical or otherwise, for reasons other than personal use, is strictly prohibited without prior written permission.
David Petch Archive |
© 2005-2022 http://www.MarketOracle.co.uk - The Market Oracle is a FREE Daily Financial Markets Analysis & Forecasting online publication.