Gold Breakout or Breakdown, What’s Next?
Commodities / Gold and Silver 2011 May 20, 2011 - 03:05 PM GMT The precious metals blogosphere was buzzing with the news that billionaire investor George Soros has sold most of his holdings in the bullion-backed SPDR Gold Trust (GLD) and iShares Gold Trust (IAU) in the first quarter of 2011. According to reports filed with the U.S. Securities and Exchange Commission, Soros bought shares of mining companies Goldcorp Inc. and Freeport-McMoRan Copper and Gold Inc. (FCX). All together Soros sold almost $800-million (U.S.) in gold.
Soros must have been pleased as punch to take his colossal profits off the table.
Last year Soros described gold as “the ultimate asset bubble” as he kept buying more gold. In a Nov. 15 speech Soros said that conditions for the metal to keep rising were “pretty ideal,” and in January this year, he said the boom in commodities may last “a couple of years” longer.
What effect did Soros’s actions have on the precious metals market? While Soros was selling (and it was not yet in the news) the precious metals markets were actually rising. By the time reports leaked that George was selling, the markets had already begun to correct. So, on the face of it, there was very little effect. We would hardly be surprised if we read in the next Securities and Exchange filing that Soros took advantage of the correction to pile into gold again. In any case, Soros’s gold is still just a small fraction of the global gold market. As a measure of gold’s acceptance as a mainstream investment, the SPDR Gold Shares was the second-most-popular E.T.F. in the United States on April 30, trailing only the SPDR S&P 500 fund.
And, if you’re still worried about Soros’s sale of his gold holdings, the next item should cheer you up. The World Gold Council yesterday reported that China’s total annual gold demand topped 700 metric tons for the first time ever last year and is expected to keep rising over the next decade. China is the second-largest gold-consuming market in the world. China’s gold demand has grown by an average of 14% per year since deregulation of the gold market by Chinese authorities in 2011. Much of the demand is due to concerns about inflation. Keep in mind that China’s market is still in the neonatal stage since it has only been a decade since deregulation. There is still plenty of room for Chinese consumers to catch up with the West.
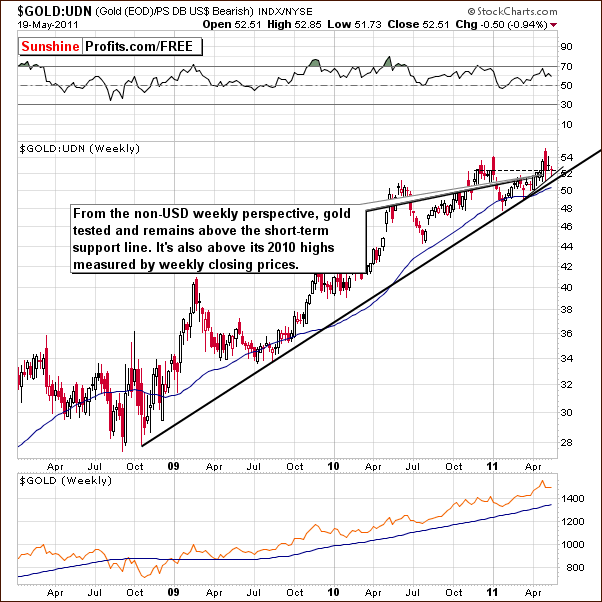
Let’s have a closer look at the gold market (charts courtesy by http://stockcharts.com). We begin with the long-term chart which looks at gold from a non-USD point of view. We do this is order to put gold’s current short-term volatility into its proper perspective.

It appears that we have simply seen a testing of the short-term support line, a verification of its support and a move to levels slightly above the 2010 highs based on weekly closing prices. The outlook therefore remains bullish and the price action seen in 2011 is actually now creating what appears to be a very bullish cup-and-handle pattern which indicates the possibility of a strong rally from here. This does not appear to be highly likely at this time but such a rally simply cannot be ruled out based on signals from the non-USD chart.

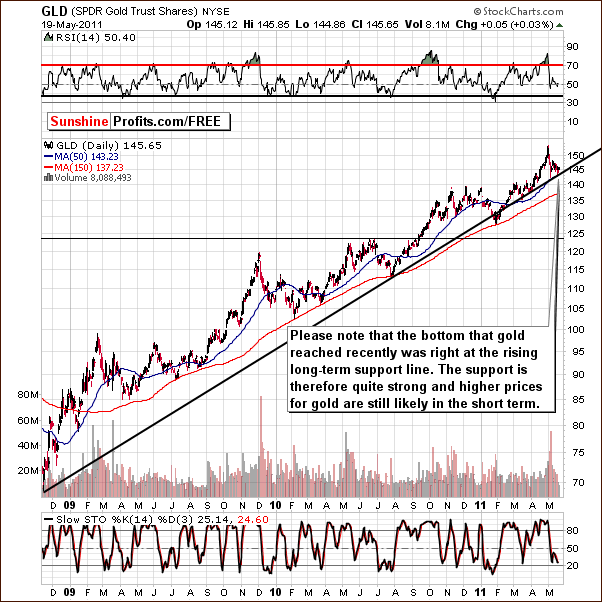
In gold’s long-term chart (see our previous essay for long-term gold price analysis) from the USD side, we see that the trend remains up. Recent price declines here were stopped by the long-term support line and the outlook still appears to be bullish at this time. Low volume levels on days with rising prices are generally a cause for concern but that may not apply in this case.
Let’s take a look at the short-term chart for more details.

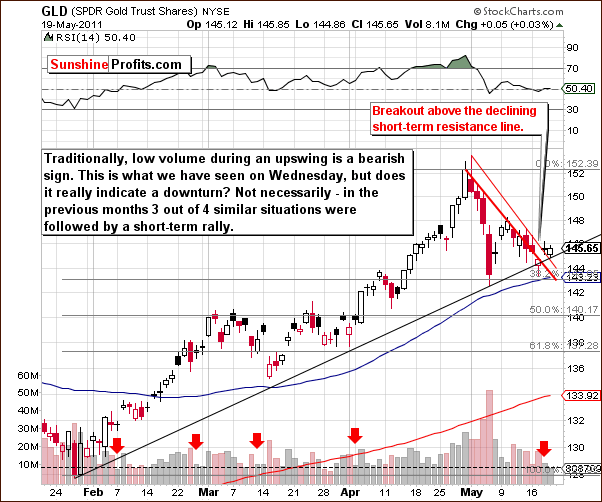
In the short term GLD ETF chart, we see a number of signals which are worthy of mention. Technical analysis generally yields negative sentiment with the type of price/volume action we see at the end of the above chart.
The case however is simply not as bearish as it would seem and it seems somewhat premature to state that buying power is drying up. We note four previous examples of similar cases (rally on small volume preceded by a decline on big volume) in this chart within the past several months. In 3 of the 4 situations, a short-term rally followed and for this reason, the situation does not appear to be bearish at this time.
A breakout above the declining short-term resistance line has actually taken place in the last two days in the chart. In fact, the resistance lines based upon daily closing prices and daily highs in our chart were both surpassed towards the end. This is overall a bullish development.
Summing up, the overall situation appears bullish for the yellow metal in the short term. Support levels have recently been tested and held, and a study of similar corrections in the recent past indicates that there appears to be at least a short-term time frame in which a further rally appears likely. Once the next local top is in, we expect the decline to continue.
To make sure that you are notified once the new features are implemented, and get immediate access to my free thoughts on the market, including information not available publicly, we urge you to sign up for our free e-mail list. Gold & Silver Investors should definitely join us today and additionally get free, 7-day access to the Premium Sections on our website, including valuable tools and unique charts. It's free and you may unsubscribe at any time.
Thank you for reading. Have a great and profitable week!
P. Radomski
Editor
Sunshine Profits
Interested in increasing your profits in the PM sector? Want to know which stocks to buy? Would you like to improve your risk/reward ratio?
Sunshine Profits provides professional support for precious metals Investors and Traders.
Apart from weekly Premium Updates and quick Market Alerts, members of the Sunshine Profits’ Premium Service gain access to Charts, Tools and Key Principles sections. Click the following link to find out how many benefits this means to you. Naturally, you may browse the sample version and easily sing-up for a free trial to see if the Premium Service meets your expectations.
All essays, research and information found above represent analyses and opinions of Mr. Radomski and Sunshine Profits' associates only. As such, it may prove wrong and be a subject to change without notice. Opinions and analyses were based on data available to authors of respective essays at the time of writing. Although the information provided above is based on careful research and sources that are believed to be accurate, Mr. Radomski and his associates do not guarantee the accuracy or thoroughness of the data or information reported. The opinions published above belong to Mr. Radomski or respective associates and are neither an offer nor a recommendation to purchase or sell securities. Mr. Radomski is not a Registered Securities Advisor. Mr. Radomski does not recommend services, products, business or investment in any company mentioned in any of his essays or reports. Materials published above have been prepared for your private use and their sole purpose is to educate readers about various investments.
By reading Mr. Radomski's essays or reports you fully agree that he will not be held responsible or liable for any decisions you make regarding any information provided in these essays or reports. Investing, trading and speculation in any financial markets may involve high risk of loss. We strongly advise that you consult a certified investment advisor and we encourage you to do your own research before making any investment decision. Mr. Radomski, Sunshine Profits' employees and affiliates as well as members of their families may have a short or long position in any securities, including those mentioned in any of the reports or essays, and may make additional purchases and/or sales of those securities without notice.
Przemyslaw Radomski Archive |
© 2005-2022 http://www.MarketOracle.co.uk - The Market Oracle is a FREE Daily Financial Markets Analysis & Forecasting online publication.


