


It’s The Debt, Dummy
Interest-Rates / US Debt Jun 12, 2011 - 03:10 AM GMTBy: James_Quinn

 I think charts tell a story that allows you to disregard the lies being spewed by those in power. Below are four charts that tell the truth about our current predicament. The first is from http://www.mybudget360.com/. The austerity and debt reduction storyline being sold by the MSM is a crock. The total amount of mortgage debt outstanding peaked at $14.6 trillion in 2008. The total amount of consumer debt (credit cards, auto loans, student, boats) outstanding peaked at $2.6 trillion in 2008. Today, mortgage debt outstanding stands at $13.8 trillion, while consumer debt stands at $2.4 trillion. Therefore, total consumer debt has declined by $1 trillion in the last three years.
The MSM and talking heads use this data to declare that consumers have been paying down debt. This is a complete and utter falsehood. The banks have written off more than $1 trillion, which the American taxpayer has unwittingly reimbursed them for. Consumers have not deleveraged. They have taken on more debt since 2008. GMAC (Ally Bank) is handing out 0% down 0% interest loans like candy again.
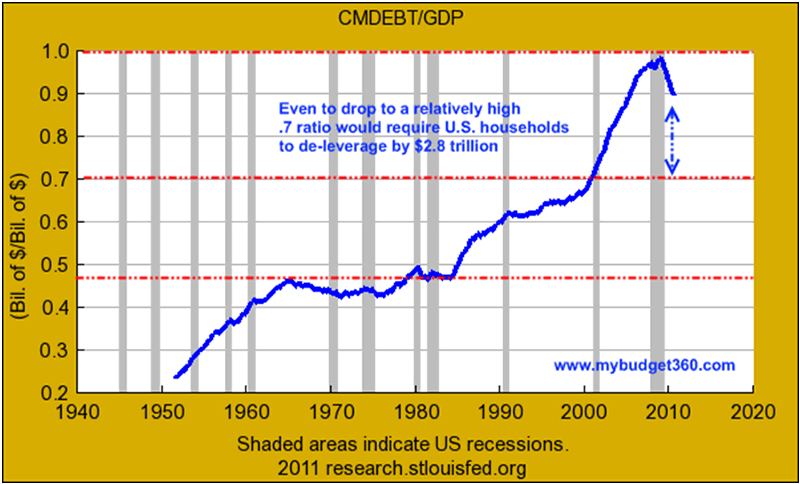
Never has a chart shown why the country is such a mess, with no easy way out. It was the early 1980′s and the Boomers were between 23 years old and 40 years old. Seventy six million Boomers were in the work force. Was it the chicken or the egg? The financial industry peddled debt as the solution to all problems. But, it was up to the Boomers to take on the debt or live within their means. Boomers chose to live for today and worry about tomorrow at some later date. There is no doubt what they did. The chart tells the story. Boomers can moan and blame and point the finger at others, but they took on the debt in order to live at a higher standard than their income would allow. This is why 60% of retirees have less than $50,000 in savings today. This is why 67% of all workers in the US have less than $50,000 in savings. A full 46% of all workers have less than $10,000 in savings.
In order for this economy to become balanced again would require consumer debt to be reduced by $3 to $4 trillion and the savings rate to double from 5% to 10%. This will never happen voluntarily. Americans are still delusional. They are actually increasing their debt as credit card debt sits at $790 billion, student loan debt at $1 trillion, auto loans at $600 billion, and mortgage debt at $13.8 trillion. The debt will not decline until an economic Depression wipes out banks and consumers alike. America will go down with a bang, not a whimper.
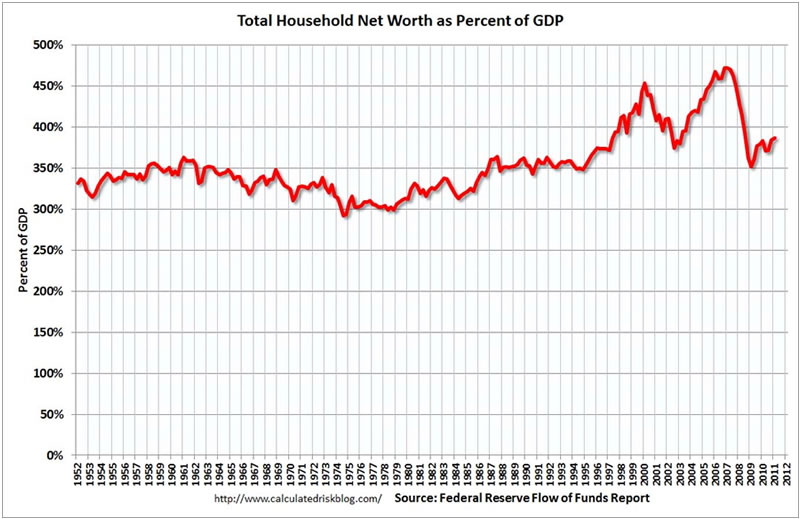
Household net worth peaked at $65.8 trillion in Q2 2007. Net worth fell to $49.4 trillion in Q1 2009 (a loss of over $16 trillion), and net worth was at $58.1 trillion in Q1 2011 (up $8.7 trillion from the trough). So, household net worth is still down by $7.7 trillion from its 2007 peak. The really bad news is that the real estate portion of household net worth dropped from $22.7 trillion in 2007 to $16.1 trillion today, a $6.6 trillion loss. Real estate continues to fall.
You can clearly see who benefitted from the monetary and fiscal stimulus implemented by Bernanke, Geithner, and Obama. If household net worth is up $8.7 trillion from the trough in early 2009, but real estate has continued to fall. This means that the entire increase in net worth came from stock market gains. As you may or may not know, the top 10% wealthiest people in the US own 81% of all the stocks in the country. The other 90% own virtually no stocks, so they have been left with depreciating houses and inflating bills for energy and food. The top 10% are about to take another multi-trillion dollar hit in the next six months as QE2 ends and the stock market implodes. This will knock the country back into deep recession.
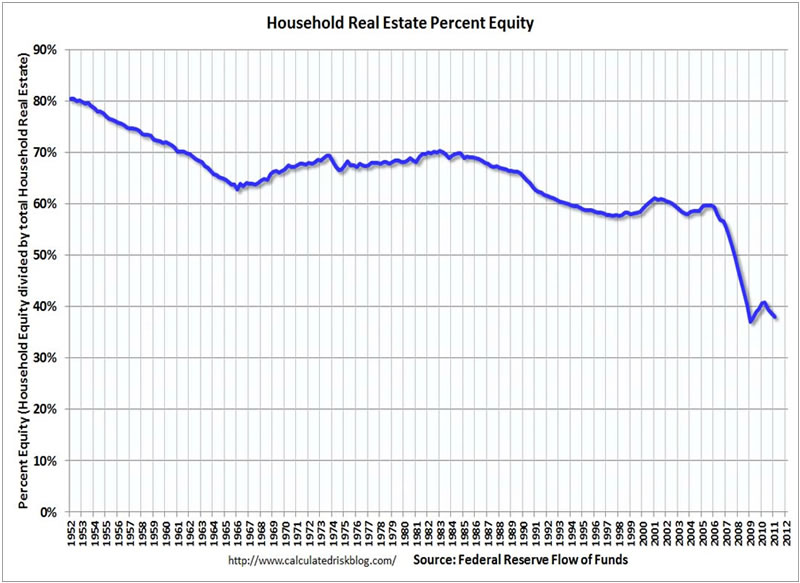
The most amazing chart of all time is the one below showing home equity since 1952. In a normal non-delusional world, people pay down the principal on their mortgage month after month, resulting in their equity in the house methodically rising. National home prices doubled between 2000 and 2005. One might ask, how in the hell could home equity drop from 60% to 58% between 2000 and 2005 when home prices went up 100%? Equity should have risen to 75%. Well the delusional Boomers struck again. The banks made it as easy as hitting the ATM to get equity out of your house and the Boomers jumped in with both feet, as usual. Americans withdrew $2.8 trillion of fake equity from their homes between 2003 and 2007. They lived the lifestyles of the rich and famous. BMWs, Mercedes, cement ponds (pools), new kitchens, Jacuzzis, home theaters, exotic vacations, hookers, facelifts, size DDs, and putting a little more in the church basket abounded.
This astounding level of stupidity and hubris left millions of Americans vulnerable when the bubble popped all over their faces. Millions have lost their homes. Almost 11 million more are underwater on their mortgage. There is years of pain to go. Household equity is now at an all-time low of 38.1%. What makes this number even more amazing is that 33% of all homes are owned outright with no mortgage. This means that the 50 million houses with a mortgage have far less than 38.1% equity. The people who sucked hundreds of thousands out of their houses to live the good life deserve to get it good and hard.
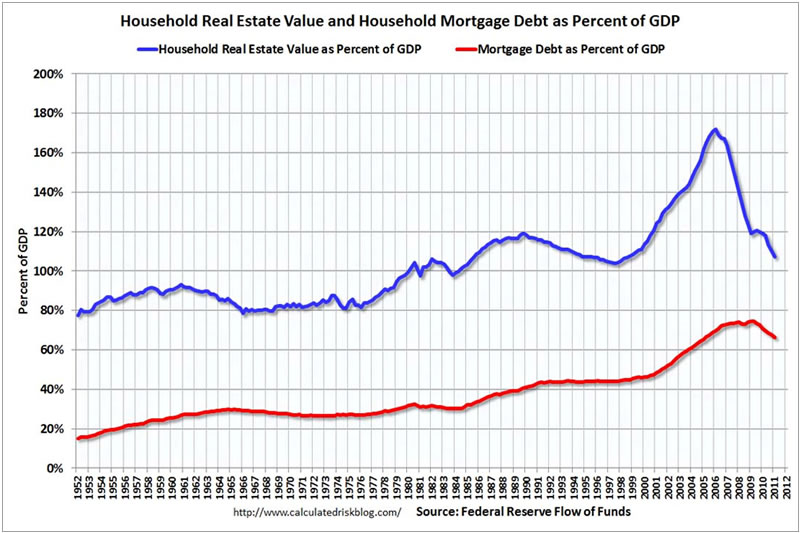
The last and most humorous graph shows how home price gains are fleeting, while the debt stays wrapped like an anchor around your neck. The greatest bubble in history was clear to Robert Shiller, John Mauldin and many other people with their eyes open. Ben Bernanke was not one of those people. He thought we had a solid housing market in 2005. Real estate values fell from 170% of GDP to 110% of GDP today, headed down to 90% or lower by 2015. The mortgage debt behind this real estate has declined by $634 billion, from 75% of GDP to 65% of GDP. Most of this was due to default, not payment.
It should be clear to anyone that we have a bit of a debt problem. The government solutions jammed down our throats since 2008 have added $7 trillion of debt to the national balance sheet. The only thing keeping this house of cards from collapsing immediately has been the extremely low interest rates put in place by the Federal Reserve. The end of QE2 potentially could result in interest rates rising. If interest rates were to rise 2%, this country’s economic system would implode. Time is not on our side. The debt cannot be repaid. The debt cannot be serviced. The debt has destroyed this country. Years from now when historians ponder what caused the great American Empire to collapse, the answer on the exam will be:
IT WAS THE DEBT, DUMMY.
Join me at www.TheBurningPlatform.com to discuss truth and the future of our country.
By James Quinn
James Quinn is a senior director of strategic planning for a major university. James has held financial positions with a retailer, homebuilder and university in his 22-year career. Those positions included treasurer, controller, and head of strategic planning. He is married with three boys and is writing these articles because he cares about their future. He earned a BS in accounting from Drexel University and an MBA from Villanova University. He is a certified public accountant and a certified cash manager.
These articles reflect the personal views of James Quinn. They do not necessarily represent the views of his employer, and are not sponsored or endorsed by his employer.
© 2011 Copyright James Quinn - All Rights Reserved
Disclaimer: The above is a matter of opinion provided for general information purposes only and is not intended as investment advice. Information and analysis above are derived from sources and utilising methods believed to be reliable, but we cannot accept responsibility for any losses you may incur as a result of this analysis. Individuals should consult with their personal financial advisors.
James Quinn Archive |
© 2005-2022 http://www.MarketOracle.co.uk - The Market Oracle is a FREE Daily Financial Markets Analysis & Forecasting online publication.