


Gold Enters Decision Making Area
Commodities / Gold and Silver 2011 Jul 11, 2011 - 01:04 AM GMTBy: Merv_Burak

 Everything looked rosy this past week but now the question, “will it stay that way?” Time will tell but the latest action is getting into a decision making area. Let’s see how gold ended the week.
GOLD
LONG TERM
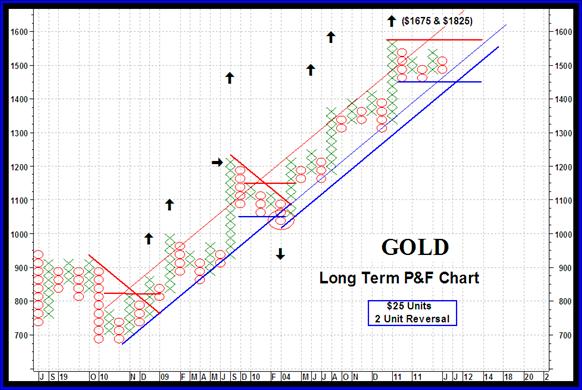
First, let’s see what the long term P&F chart is telling us, if anything. I had used a $15 unit chart for the long term in the past but the action has taken us higher to the point that a $15 unit chart is not appropriate any longer to represent the long term. I have increased the Unit price to the $25 level. Today’s P&F chart shows the bull market from the late 2008 lows to the present. Also shown on the chart are price projections at significant price break-out locations as time progressed. Up and down trend lines are shown as is the resistance up trend line. Heavy lines are primary while the thinner lines are secondary. My simple criteria is that for the bull market to reverse into a bear market (P&F wise) requires a break below two previous lows AND below the primary up trend line. The reverse is true to go from a bear to a bull trend. The price projections are based upon the horizontal count method although a couple are of the vertical count method. I wouldn’t go into a detailed explanation here, it would take too long for a weekly commentary post.
Before checking where we are at the present time on the P&F chart I’ll just highlight a couple of items. First, we did have a reversal to the bear at the $1050 level which turned out to be a false signal. This was quickly corrected on the move to $1175. The second feature to highlight is the resistance up trend line (thin red line). The action has stayed at or below this resistance line for most of the move since the new bull started in late 2008. The few times it over reached and broke above the resistance line gold quickly reversed and dropped back below the line. This is a feature of P&F charts often ignored but is an important feature.
Now, where are we on the P&F chart? We are into a lateral box pattern of the kind that Nicolas Darvas followed to make his millions in the 1960’s (he might have made even more money from his book “How I Made $2,000,000 in the Stock Market). Not bad for a professional dancer. A move to $1600 would break out of the box and provide, as Darvas would predict, a new buying opportunity. On the other hand should gold move to $1450 that would be a bearish break and another kettle of fish. From my P&F criteria there would still need to be a break below that primary up trend line for a P&F bear signal so let’s wait to see which way the flow goes. For now the long term P&F is still bullish.
Back to our normal analysis.
Trend: Gold remains above its positive sloping long term moving average line with no immediate sign of trouble.
Strength: The long term momentum indicator remains in its positive zone and has closed above its trigger line. The trigger has also just turned to the up side.
Volume: The volume indicator continues in an upward trend almost entering into new all time highs. It continues above its positive sloping trigger line.
The long term rating remains BULLISH.
INTERMEDIATE TERM
The gold action during the week has improved the position of gold from the intermediate term perspective.
Trend: Gold closed the week above its intermediate term moving average line and the line has turned to the up side.
Strength: The intermediate term momentum indicator continues in its positive zone and closed the week above its positive sloping trigger line.
Volume: The volume indicator remains positive and above its positive trigger line.
On the intermediate term the rating has once more turned to the fully BULLISH side. This bull is not yet confirmed by the short term moving average line, which remains slightly below the intermediate term line.
SHORT TERM
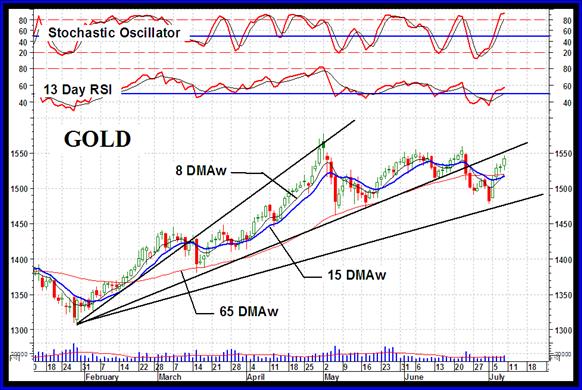
After a down side break from a Head and Shoulder pattern it is not unusual for the price to rally back towards the neckline before continuing on its downward path. We are in one of those rallies. Now the greatest concern is that it will be only a rally and not a bullish move negating the head and shoulder break. My analysis is from the standpoint of where we are at this point in time and not a prediction of where the market will be tomorrow, the next week or the next month. As a market follower I let the market tell me where it’s at.
We have an intermediate term Bearish Decelerating FAN trend lines. As often mentioned, when we get one of these patterns the breaking of the second FAN trend line is the reversal signal while the breaking of the third FAN trend line is a trend reversal confirmation. We have the reversal but not yet the confirmation. This goes along with last week’s intermediate term bear rating but does not yet confirm the reversal back to the bull side. A move back into the area between the first and second FAN trend lines would negate the FAN bear signal.
Trend: Gold has once more closed above its short term moving average line and the line has turned to the up side.
Strength: The short term momentum indicator has moved back into its positive zone above its positive trigger line.
Volume: The daily volume action remains low and is a worry. I like to see the volume activity perk up on the up side, which would be the normal action during a bull move.
On the short term the rating has once more turned to the BULLISH side. This is confirmed by the very short term moving average line closing above the short term line.
As for the immediate direction of least resistance, I’m going with the lateral direction. Although the latest moves in the gold price have been to the up side and the Stochastic Oscillator has been zooming upward things have gotten just too good too fast. The price is now up against the FAN resistance line and the H&S neckline (both basically the same lines) while the SO has entered its overbought zone. Being in the overbought zone just indicates that the trend has been a strong one BUT what we look for is for the SO to weaken and move below its trigger line and below its overbought line. That would suggest a weakening in very short term momentum BUT that has not happened yet. It does look like the SO has reached a high and may be in a turning mode but that might still be a day or two away, so lateral is the best guess for the next day or two.
SILVER
Silver has been a bummer for some time now but this past week was a good one with silver weekly performance outdoing gold by 8.4% to 4.0% (see the Table below). So where has that left silver at the Friday close?
LONG TERM
The long term P&F chart for silver is telling us that silver price was way overdone and has now come back to earth. It remains above its long term up trend line and is boxed in into a horizontal trend for now. That would change, P&F wise, with a move to either $40 for a new bull trend continuation or to $32 for a bear reversal. But let’s see what the normal indicators are telling us as to where silver is at this time.
Trend: Silver dropped below its long term moving average line last week but is once more above the line. The line itself continues in an upward slope.
Strength: The long term momentum indicator remains in its positive zone but had been below its trigger line last week. As with the price, the momentum has moved above its trigger line and the trigger has turned back to the up side.
Volume: The volume indicator has been moving sideways since May but in general has stayed above its trigger line. It remains slightly above the trigger and the trigger remains slightly in an upward slope.
All in all, the long term rating at the Friday close is BULLISH.
INTERMEDIATE TERM
Trend: Since the May plunge silver has been tracing a lateral path but continually below its negatively sloping moving average line. It closed on Friday just below the line.
Strength: The intermediate term momentum indicator has also been tracing a lateral path since the May plunge. This path has been along its neutral line with the indicator bouncing around above and below the line. On the Friday close the indicator closed above the line and above its positive sloping trigger line.
Volume: As with the long term the volume indicator has been moving sideways but here it has been bouncing above and below its trigger line. On the Friday close the indicator ended above the line and the line remains in a positive slope.
For the intermediate term the silver rating has improved but only to the – NEUTRAL level, one step above a full bear. The short term moving average line remains below the intermediate term line confirming that we are still not in bullish territory yet.
SHORT TERM
On the short term things are brighter.
Trend: Silver closed the week above its positive sloping short term moving average line.
Strength: The short term momentum indicator has moved into positive territory and is at its highest level since the plunge of early May. It is above its positive sloping trigger line.
Volume: The daily volume action is the real concern here. During an upward move it is a normal action to see the daily volume increase with the rise in price. We do not see that here. Speculators seem not to be too convinced that silver is ready for a new bull move, at least not yet.
Despite the concern raised by the poor volume action the short term rating ends up to be BULLISH, confirmed by the very short term moving average line closing above the short term line.
PRECIOUS METAL STOCKS
It was a very good week for the precious metal stocks but from a long and, to a great extent, intermediate term we still do not have a trend reversal confirmed. The Table below provides us with ratings for the various Indices for the intermediate and long term. I also have additional ratings that I follow for my universe of 160 stocks. The overall BULLISH/BEARISH percentage shows the short term at a 77% bullish rating for the 160 stocks while the intermediate term shows only a 43% bullish and the long term a 30% bullish rating. More work is required before the overall % ratings go into a full bull area.
I was going to show the Merv’s Penny arcade Index this week but I already have three Indices and some sites that allow my commentaries to be posted have limitations on how many charts I can provide per post. I’ll show the Index next week.
Merv’s Precious Metals Indices Table
Well, that’s it for this week. Comments are always welcome and should be addressed to mervburak@gmail.com.
By Merv Burak, CMT
Hudson Aero/Systems Inc.
Technical Information Group
for Merv's Precious Metals Central
For DAILY Uranium stock commentary and WEEKLY Uranium market update check out my new Technically Uranium with Merv blog at http://techuranium.blogspot.com .
During the day Merv practices his engineering profession as a Consulting Aerospace Engineer. Once the sun goes down and night descends upon the earth Merv dons his other hat as a Chartered Market Technician ( CMT ) and tries to decipher what's going on in the securities markets. As an underground surveyor in the gold mines of Canada 's Northwest Territories in his youth, Merv has a soft spot for the gold industry and has developed several Gold Indices reflecting different aspects of the industry. As a basically lazy individual Merv's driving focus is to KEEP IT SIMPLE .
To find out more about Merv's various Gold Indices and component stocks, please visit http://preciousmetalscentral.com . There you will find samples of the Indices and their component stocks plus other publications of interest to gold investors.
Before you invest, Always check your market timing with a Qualified Professional Market Technician
Merv Burak Archive |
© 2005-2022 http://www.MarketOracle.co.uk - The Market Oracle is a FREE Daily Financial Markets Analysis & Forecasting online publication.