


Gold and Silver Picking Up Steam Relative to Stocks
Commodities / Gold and Silver 2011 Jul 14, 2011 - 05:09 AM GMTBy: Chris_Ciovacco

 Before we check in on the current status of gold (GLD) and silver (SLV), it is helpful to review their fundamental appeal to investors. Studying the performance of silver relative to gold is not just for gold bugs; it can help us monitor the health of the ‘risk on trade’ relative to the ‘risk off trade’ in many markets, including stocks (SPY) and commodities (DBC).
While gold (GLD) and silver (SLV) are often grouped together in investment discussions, gold has more of an Armageddon appeal and silver has more of an industrial appeal. Generally, when the gold/silver ratio is rising, it signals higher levels of fear and concern about the economic outlook. Notice how gold was much more attractive in the minds of market participants during the 2008 portion of the last bear market (see below).
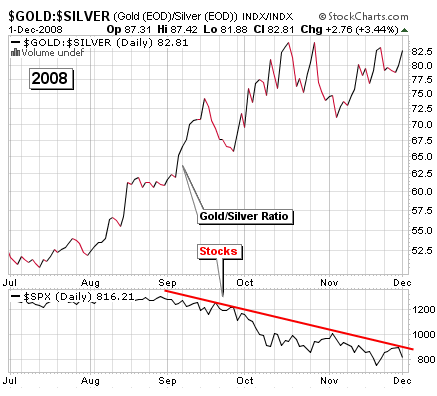
Silver tends to be in greater demand relative to gold during economic expansions and bull markets. Gold tends to be in greater demand when concerns rise about economic downturns or geopolitical events. These basic investment tenants describe how investors can benefit from monitoring the gold-silver ratio (shown above), which is simply a study of the demand for gold relative to the demand for silver.
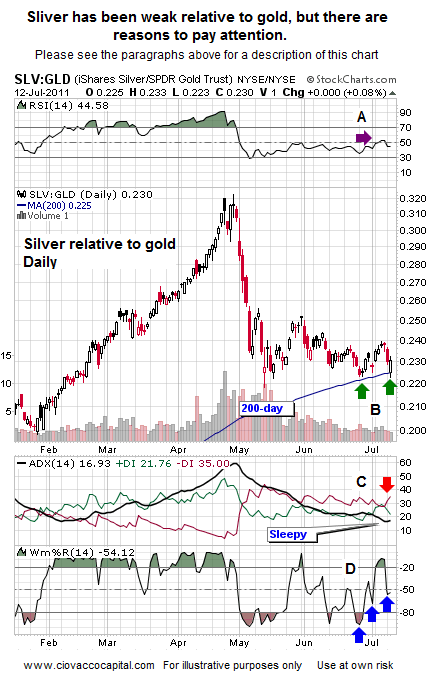
Today, we will flip the ratio and look at silver relative to gold (SLV divided by GLD). We sold all our silver in early May and kept our gold, which turned out to be a fortunate move since silver has continued to lag gold for the last ten weeks (see right side of chart below).
The Relative Strength Index (RSI) of silver relative to gold is shown near point A below. RSI has remained below 50 since early May, which tells us silver has been generally bearish relative to gold. A possible bright spot for silver is RSI did recently break above 50 for the first time in nine weeks. This is a subtle change and one that tells us to watch silver a little more closely. Point B shows the silver-gold ratio did find support at its 200-day moving average (green arrows). If silver is going to pick it up vs. gold, making a stand near the 200-day is logical, since 200-day moving averages often serve as bull/bear lines of demarcation.
Notice the silver-gold ratio did muster a higher high and higher low recently (near point B). This is the first sign of a possible trend change and another reason to watch silver. ADX (point C) can help us better understand trends and the strength of trends. When ADX red is higher than ADX green (see red arrow), it gives the nod to the bears. The black ADX line currently shows a weak trend or sleepy market, which means conditions are in place for a bigger move (up or down) in the silver-gold ratio. The Wm %R has made a series of higher lows (see blue arrows near point D), which indicates a reduction in the desire to sell silver relative to gold.
Since peaking in late 2009, gold has experienced relatively tame performance vs. the S&P 500. The chart below shows gold’s performance relative to the S&P 500 Index (GLD divided by the S&P 500). There are several positive shifts occurring on the chart below indicating now is a good time to consider adding to our positions in gold (emphasis on consider).
RSI often leads price. Near point A, RSI recently broke above a downward-sloping trendline, which is a bullish signal for gold relative to stocks. Point B shows price is also trying to complete a move above the downward sloping blue trendline. Notice the gold-S&P 500 ratio was able to hold above line B-2 recently, which is another check on the bullish side of gold’s ledger.
Moving to the bottom portion of the chart below, the orange lines (O-1 and O-2) indicate a somewhat tepid interest in gold relative to stocks since late 2009. Point C shows MACD is trying to make a positive turn. In terms of being bullish on gold, we would like to see the black line cross the red line near point C. Rate of Change (ROC) is shown near point D. Another good sign for gold relative to stocks is ROC has moved back above zero.
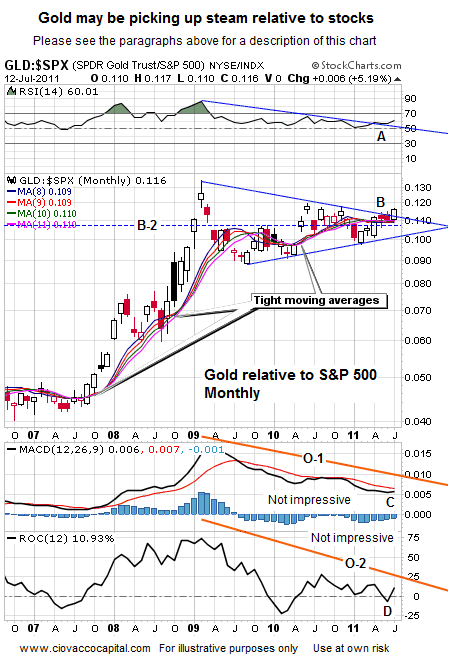
The last important point in the chart above relates to the moving averages (thin colored lines). Moving averages help smooth out trends by removing some day-to-day volatility. The notation on the chart above points out three times when the gold-S&P 500 ratio broke above a tight band of moving averages, an area where support and resistance can be strong. Notice the ratio picked up momentum in a bullish manner after a break above the tight moving average bands. Near point B, the ratio recently broke above, and held above, a tight band of the moving averages, which leans bullish for gold relative to stocks.
It should be noted that the chart above is a monthly chart. The bullish developments in gold relative to stocks become much more meaningful if they can hold into the end of July.
How can all this help us? It is a good time to monitor gold and consider adding to our positions, especially if the gold ETF (GLD) can see gains on impressive volume. It is also a good time to keep an open mind about a possible re-entry point for silver. If you own stocks and commodities, you would prefer to see silver win the battle relative to gold. Strength in silver relative to gold tends to occur during economic expansions and periods when the ‘risk on trade’ is in favor.
By Chris Ciovacco
Ciovacco Capital Management
Copyright (C) 2011 Ciovacco Capital Management, LLC All Rights Reserved.
Chris Ciovacco is the Chief Investment Officer for Ciovacco Capital Management, LLC. More on the web at www.ciovaccocapital.com
Ciovacco Capital Management, LLC is an independent money management firm based in Atlanta, Georgia. As a registered investment advisor, CCM helps individual investors, large & small; achieve improved investment results via independent research and globally diversified investment portfolios. Since we are a fee-based firm, our only objective is to help you protect and grow your assets. Our long-term, theme-oriented, buy-and-hold approach allows for portfolio rebalancing from time to time to adjust to new opportunities or changing market conditions. When looking at money managers in Atlanta, take a hard look at CCM.
All material presented herein is believed to be reliable but we cannot attest to its accuracy. Investment recommendations may change and readers are urged to check with their investment counselors and tax advisors before making any investment decisions. Opinions expressed in these reports may change without prior notice. This memorandum is based on information available to the public. No representation is made that it is accurate or complete. This memorandum is not an offer to buy or sell or a solicitation of an offer to buy or sell the securities mentioned. The investments discussed or recommended in this report may be unsuitable for investors depending on their specific investment objectives and financial position. Past performance is not necessarily a guide to future performance. The price or value of the investments to which this report relates, either directly or indirectly, may fall or rise against the interest of investors. All prices and yields contained in this report are subject to change without notice. This information is based on hypothetical assumptions and is intended for illustrative purposes only. THERE ARE NO WARRANTIES, EXPRESSED OR IMPLIED, AS TO ACCURACY, COMPLETENESS, OR RESULTS OBTAINED FROM ANY INFORMATION CONTAINED IN THIS ARTICLE. PAST PERFORMANCE DOES NOT GUARANTEE FUTURE RESULTS.
Chris Ciovacco Archive |
© 2005-2022 http://www.MarketOracle.co.uk - The Market Oracle is a FREE Daily Financial Markets Analysis & Forecasting online publication.