


U.S. and European Policymakers Help Improve Stock Market Leadership
Stock-Markets / Global Stock Markets Jul 20, 2011 - 12:44 PM GMTBy: Chris_Ciovacco

 News coming from the United States and Europe has once again changed the tone in a fast-pasted market. On our side of the pond, the Wall Street Journal reported:
President Barack Obama, in a last-ditch bid for a bipartisan “grand bargain” on the budget, threw his weight Tuesday behind a $3.7 trillion deficit-reduction plan unveiled by six Republican and Democratic senators.
In Europe, according to Bloomberg:
German Chancellor Angela Merkel and French President Nicolas Sarkozy will meet today to seek common ground on fighting the debt crisis before a European summit that their Greek counterpart says could make or break the euro.
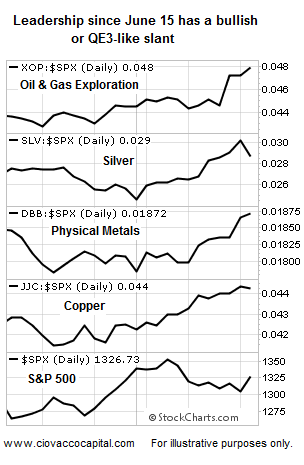
One of our concerns off the June lows in the S&P 500 was the lack of market leadership. The major indexes were doing the heavy lifting, indicating a skeptical bent from market participants. We remain concerned about this issue, but the situation is improving (a little). The chart below shows some of the strongest movers since June 15. Ben Bernanke’s hint at QE3 is probably partially responsible for the moves in metals and energy, but there is a component of “we can avoid Armageddon” as well.
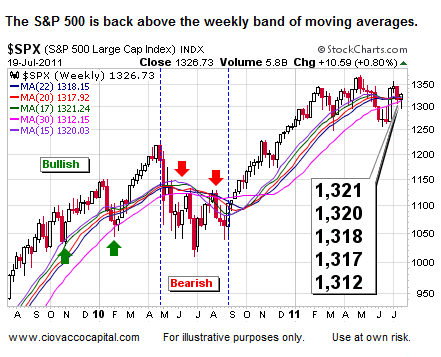
An updated version of the weekly chart we presented on July 14 is shown below. The thin blue lines are weekly moving averages ranging from 15 to 30 weeks. As shown on the left side of the chart, the market tends to be healthy when stocks hold above the band of moving averages. The center of the chart shows a bearish bias when the S&P 500 drops below the band of moving averages. On July 19, the S&P 500 clawed its way back above the top of the band, which sits at 1,321. This move is positive for stocks, especially if (a) stocks can hold above the moving averages into week’s end, and (b) if the market can move away from the colored band, giving us a better feel for the final outcome related to the current period of consolidation.
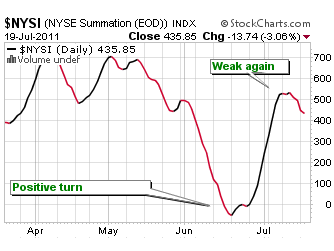
While market breadth (advancers vs. decliners) was good on July 19, it has not improved enough yet to allow the Summation Index to turn back up (see below), indicating that intermediate-term market breadth still has a bearish bias. A turn back up in the Summation Index would bolster the somewhat weak, but improving bullish case for U.S. stocks.
Since the situation in Europe seems to be on shakier ground than the U.S., let’s check in on how German stocks (EWG) are holding up. While the chart below looks complex, the concepts are easy to understand. Price, shown in the middle of the chart, recently made somewhat of a “sideways” low (compare points A1 and B1). The Relative Strength Index (RSI), shown at the top, made a slightly higher low (compare A and B), which gives the bulls a very slight advantage. The same signal is present in the MACD Histogram (compare A2 to B2). The bullish divergences shown via A, B, A1, B1, A2, and B2 tell us that the desire to sell on the second move down (point B1) was not as strong as it was on the first move down (point A1).
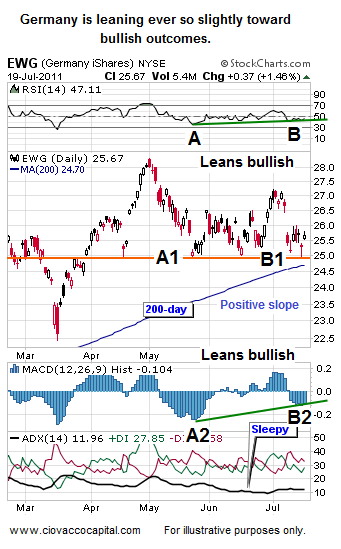
The other take aways from Germany above are (1) The slope of the 200-day moving average remains positive, and (2) the ADX black line (see bottom of chart above) indicates a trendless or sleepy market; one in which a big move (up or down) could be in the cards. The importance of the 200-day’s slope is covered in this July 19 video, which outlines the current risk-reward profile of U.S. stocks. The concepts presented in the video apply to all markets, including Germany.
How can all this help us? While the big picture remains fragile, subtle indications are lining up for the bulls. Given what we know today, exposure to this market is still warranted since, in simple terms, the current market still looks like a bull market. If the market can maintain a bullish bias, we will be interested in energy (XOP), copper (JJC), gold (GLD), and silver (SLV), in terms of their intermediate-term outlook (next few months). We also will maintain some exposure via low-expense, and liquid instruments, such as SPY, since they provide a high degree of flexibility (easy to run for exits if needed).
By Chris Ciovacco
Ciovacco Capital Management
-
Copyright (C) 2011 Ciovacco Capital Management, LLC All Rights Reserved.
Chris Ciovacco is the Chief Investment Officer for Ciovacco Capital Management, LLC. More on the web at www.ciovaccocapital.com
Ciovacco Capital Management, LLC is an independent money management firm based in Atlanta, Georgia. As a registered investment advisor, CCM helps individual investors, large & small; achieve improved investment results via independent research and globally diversified investment portfolios. Since we are a fee-based firm, our only objective is to help you protect and grow your assets. Our long-term, theme-oriented, buy-and-hold approach allows for portfolio rebalancing from time to time to adjust to new opportunities or changing market conditions. When looking at money managers in Atlanta, take a hard look at CCM.
All material presented herein is believed to be reliable but we cannot attest to its accuracy. Investment recommendations may change and readers are urged to check with their investment counselors and tax advisors before making any investment decisions. Opinions expressed in these reports may change without prior notice. This memorandum is based on information available to the public. No representation is made that it is accurate or complete. This memorandum is not an offer to buy or sell or a solicitation of an offer to buy or sell the securities mentioned. The investments discussed or recommended in this report may be unsuitable for investors depending on their specific investment objectives and financial position. Past performance is not necessarily a guide to future performance. The price or value of the investments to which this report relates, either directly or indirectly, may fall or rise against the interest of investors. All prices and yields contained in this report are subject to change without notice. This information is based on hypothetical assumptions and is intended for illustrative purposes only. THERE ARE NO WARRANTIES, EXPRESSED OR IMPLIED, AS TO ACCURACY, COMPLETENESS, OR RESULTS OBTAINED FROM ANY INFORMATION CONTAINED IN THIS ARTICLE. PAST PERFORMANCE DOES NOT GUARANTEE FUTURE RESULTS.
Chris Ciovacco Archive |
© 2005-2022 http://www.MarketOracle.co.uk - The Market Oracle is a FREE Daily Financial Markets Analysis & Forecasting online publication.