


Gold Makes New Highs, But Something Does Not Feel Right
Commodities / Gold and Silver 2011 Jul 31, 2011 - 02:56 PM GMTBy: Merv_Burak

 Well you can’t much argue with new highs but you can be cautious. Something just doesn’t seem right, at least not from the short term, although the long term continually looks great for gold (and silver).
OIL
I know this is a commentary on the precious metals (gold and silver) but I thought I’d just throw in a chart of oil. It seems to be ready for a major downside break.
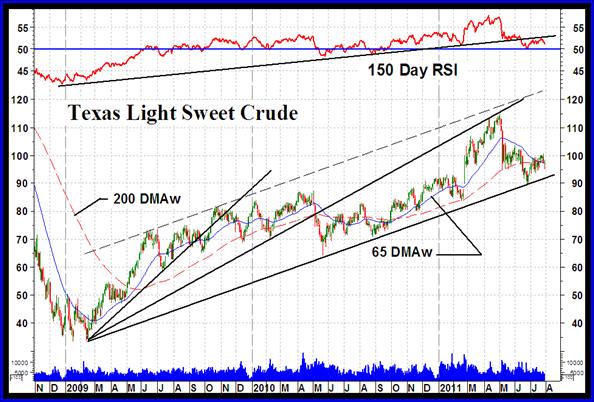
I don’t intend to go into a detailed technical analysis of oil here but will just briefly comment on a couple of chart patterns that are easily spotted by a simple technician.
The price of oil (Texas Light Sweet Crude) seems to be trapped inside two separate patterns, a wide upward sloping channel and a bearish Decelerating FAN trend lines.
From the channel perspective oil is very near its lower support line. A breach of this line is a serious bearish indicator. On the other hand oil could just bounce off the support and head back towards the upper resistance line. Take your pick.
As for the FAN trend lines, usually the breaking of the second FAN trend line tells me that the trend had ended but it requires the breaking of the third FAN trend line to confirm. Since the establishment of the third FAN trend line, from the low in mid-May 2010, the market action has remained trapped within the confines of the second and third FAN lines. As you can see, the third FAN trend line is also the lower support line from the channel. Again, a breaking of this support line is also now a confirmation of the bear per my FAN Principle. So, we are in nail biting territory until the smoke clears, one way or the other. Watch a move below the $90 level or above the $100 level. That should warn you of which way the wind in blowing.
Two final quick notes: my Table of Non-Edibles Futures Indices already has oil rated as NEG (bearish). You can access the table at http://preciousmetalscentral.com and go to the commentary download link. Secondly, my long term momentum indicator has already broken below its long term up trend line for a negative cautionary sign possibly forecasting the future move in oil.
GOLD
LONG TERM
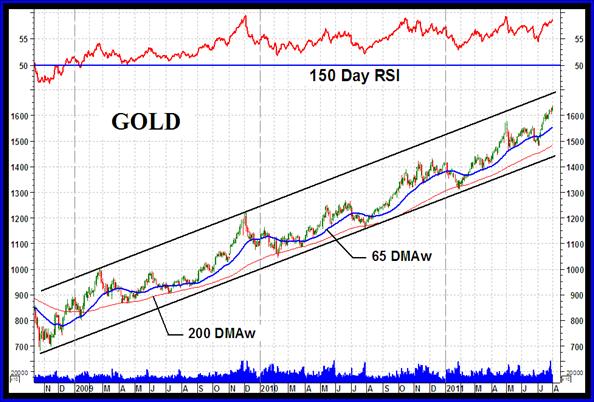
Sometimes just a few seconds look at a chart and one can say, “no problemo, moochachoes” or something like that. Gold continues its two and a half year bull move with no real end in sight, at least not from the long term standpoint. The long term momentum indicator is still far from any serious warning of possible problems ahead. Sit back and relax. The only cautionary element from this chart is the fact that the up side does not seem to have much more room for growth while the price could drop considerably and still be inside the up trending channel.
Trend: Gold continues to move higher above its positive sloping long term moving average line.
Strength: The long term momentum indicator is well entrenched in its positive zone above its positive sloping trigger line. It is within a heart beat of its previous high levels, within any margin of error.
Volume: The volume indicator is plowing ahead in its all time high territory above its positive sloping trigger line.
The long term rating can only be BULLISH with all that.
INTERMEDIATE TERM
The intermediate term still looks like a run-away on the up side, with some caution.
Trend: The trend continues higher but seems to hesitate at times. Gold remains above its positive sloping intermediate term moving average line and despite some hesitation there is no immediate hind of a reversal.
Strength: The intermediate term momentum indicator remains in its positive zone above its positive sloping trigger line. It is showing some minor weakness versus its advance last April but the advance is not over yet and the strength might come back.
Volume: The volume indicator continues to show strength and remains above its positive trigger line.
On the intermediate term the rating remains BULLISH. This is confirmed by the short term moving average continuing its move above the intermediate term average.
SHORT TERM
Short term things look more precarious. Friday’s sharp move into new highs was on greatly reduced volume, not encouraging. The past couple of weeks of positive price action has also been on greatly diminished strength. The short term momentum indicator has not been able to breach its highs from a couple of weeks back despite the strong price move. From a very short term perspective the Stochastic Oscillator has shown even greater weakness. All this seems to be suggesting we should expect a price reversal any day now. However, despite these warnings the Friday position of gold remains okay, i.e. the reversal has not yet started. Maybe tomorrow? Or Tuesday?
Trend: Gold has been comfortably above its short term positive sloping moving average line for four weeks now. Time for a change?
Strength: As mentioned above the short term momentum indicator is showing weakness versus the price move. One might suggest this is a negative divergence but it’s too early to
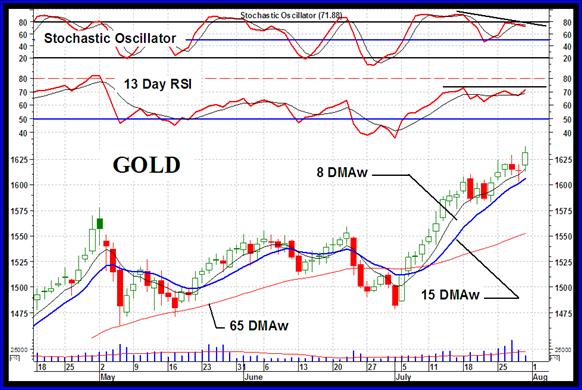
say that. We need the price to turn around and then see if the momentum indicator reached new highs or gave us a negative divergence. Still, the momentum indicator IS in its positive zone and above a positive trigger line.
Volume: The daily volume action is giving us some headaches. The very high volume day on a down price day a few days back with a low volume day during an upside move on Friday does not give one confidence that the upward move has much longevity left in it.
Putting it all together the short term rating remains BULLISH but could change very fast. The very short term moving average line confirms this bull.
As for the immediate direction of least resistance, the Stochastic Oscillator is suggesting very serious weakness from the very short term perspective. Despite Friday’s move the SO continued in a downward path. I will go with the lateral direction BUT it does look like the downside is getting more possible every day.
SILVER
The silver long term P&F chart did make an upside break but the projection, based upon its consolidation period, is only to the $49 mark. That is to the previous high, P&F wise, and not quite into new high territory. Although these projections are often conservative one would not put money on them being so. For now, if speculating in silver from the short to intermediate term one should keep this projection in mind. In any case, projection or not, one would follow the charts and stay with the trend or get out if the trend ends.
LONG TERM
Trend: Silver continues to trade above its positive sloping long term moving average line.
Strength: The long term momentum indicator continues in its positive zone above its positive trigger line. Having said that it is showing weakness versus previous moves. In other words this move does not have the strength behind it that previous bull moves had. This should be considered as a warning of possible trouble ahead.
Volume: Here too the volume indicator can be considered as positive being above its positive sloping trigger line. However, the recent volume action has been decidedly weaker than previous rallies.
Still, all in all the long term rating at the Friday close remains BULLISH.
INTERMEDIATE TERM
Trend: Silver remains above its intermediate term moving average line and the line slope is to the up side.
Strength: The intermediate term momentum indicator remains in its positive zone but by Friday close has dropped below its trigger line. The trigger although in the process of turning down has not quite made it and remains very slightly with a positive slope.
Volume: The volume indicator is showing weakness but remains above its intermediate term positive trigger line.
For now the intermediate term rating remains BULLISH. This is confirmed by the short term moving average line continuing to move above the intermediate term line.
SHORT TERM
Trend: The short term trend appears to be in the process of topping out. It has been toying with its short term moving average line but has not quite moved below it on a closing basis. Silver closed on Friday just above its positive short term moving average line.
Strength: The short term momentum indicator seems to have also topped out. It has broken below a well defined short term up trend line for a serious short term warning. However, it is still in its positive zone but already below its negative trigger line.
Volume: The daily volume action throughout its recent advance has been relatively low and not a good sign.
For now the short term rating must still be classified as BULLISH but with change possibly happening momentarily. The very short term moving average line is confirming this bull rating and caution as it has turned downward and is very close to moving below the short term line.
Holiday trip - There will be no commentary next week
Merv’s Precious Metals Indices Table
Well, that’s it for this week. Comments are always welcome and should be addressed to mervburak@gmail.com.
By Merv Burak, CMT
Hudson Aero/Systems Inc.
Technical Information Group
for Merv's Precious Metals Central
For DAILY Uranium stock commentary and WEEKLY Uranium market update check out my new Technically Uranium with Merv blog at http://techuranium.blogspot.com .
During the day Merv practices his engineering profession as a Consulting Aerospace Engineer. Once the sun goes down and night descends upon the earth Merv dons his other hat as a Chartered Market Technician ( CMT ) and tries to decipher what's going on in the securities markets. As an underground surveyor in the gold mines of Canada 's Northwest Territories in his youth, Merv has a soft spot for the gold industry and has developed several Gold Indices reflecting different aspects of the industry. As a basically lazy individual Merv's driving focus is to KEEP IT SIMPLE .
To find out more about Merv's various Gold Indices and component stocks, please visit http://preciousmetalscentral.com . There you will find samples of the Indices and their component stocks plus other publications of interest to gold investors.
Before you invest, Always check your market timing with a Qualified Professional Market Technician
Merv Burak Archive |
© 2005-2022 http://www.MarketOracle.co.uk - The Market Oracle is a FREE Daily Financial Markets Analysis & Forecasting online publication.