


The Next Down Leg of the U.S. Housing Bear Market has Begun
Economics / US Housing Aug 01, 2011 - 03:38 PM GMTBy: Clif_Droke

 Now that the latest round of quantitative easing (QE) has ended, it's time to take stock of whether inflation or deflation is likely to gain the upper hand going forward.
The Fed's monetary stimulus efforts of the last three years have done nothing to help what is arguably the biggest symptom of long-term deflation, namely the housing market. It's important to recall that the final "hard down" portion of the 60-year cycle of inflation/deflation cycle began with a collapse of real estate prices. The real estate bear market has been the chief evidence of deflation in the U.S. for the housing market prior to the crash represented the biggest form of savings for most Americans.
As many Americans have discovered, real estate is an excellent asset to own during the inflationary phase of the long-term cycle of inflation/deflation but it's one of the worst assets to own during hyper deflation. As an illiquid asset, housing prices tend to depreciate in the final deflationary years of the long term cycle. This is another proof that the deflationary cycle hasn't yet bottomed; viz. until real estate bottoms we can only assume the 60-year cycle still hasn't bottomed.
After falling for eight consecutive months and double-dipping below the previous lows set in April 2009, the Case-Shiller 20-City Home Price Index showed a minor uptick in its latest reporting period of April 2011. The Case-Shiller Index has a bit of a lag to it but is a fair approximation for nationwide housing prices.
As real estate experts have pointed out, however, the year-over-year declines for the Case-Shiller Index shows that the U.S. housing market is getting worse, not better. As you can see in the following chart, the 20-City composite is still 4% lower than its April 2010 levels and is also lower than the 3.8% year-over-year decline of the previous month.
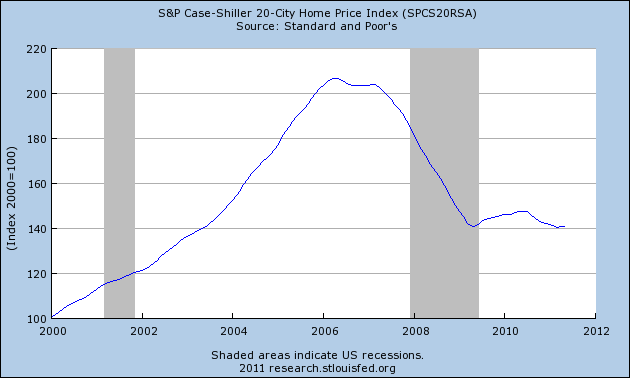
The Case-Shiller chart shows that the main trend for nationwide real estate prices is still down. When it comes to reversing a real estate market decline, it's going to take several months of increasing home prices, substantial enough to shift the year-over-year momentum from negative to positive.
Another symptom that the real estate bear market still has further to run before exhausting is found in the revelation that the nation's largest bank (by assets) is still haunted by bad mortgages. Bank of America (BAC) is spending billions of dollars in trying to repair its balance sheet in the wake of the housing collapse. BAC announced a quarterly loss of $8.83 billion on July 19, the biggest in its history. The bank's mortgage unit's loss widened to $14.5 billion, from $1.5 billion the previous year. In total, BAC has lost about $38 billion in market value in the year to date as mortgage costs continue to dent the bank's earnings.
To give you an idea of just where Bank of America - along with the USA's other major banks - are headed, check out the chart shown below. It compares the Bank Index (BKX) with the S&P 500 Index (SPX). The BKX is the blue line while the SPX is the red line.
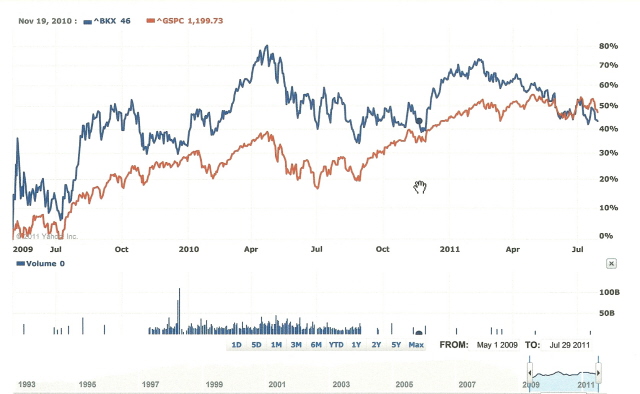
After rebounding strongly in 2009-2010, the banks topped out over a year ago and haven't been able to make a higher high since. The BKX has instead made a lower high between April 2010 and February 2011 and has been in a downward trend ever since the peak made earlier this year. In an earlier commentary I wrote entitled "Leading Indicators and the Greek Debt Crisis," I drew attention to the conspicuous lag in the BKX as well as the Broker/Dealer Index (XBD) as a technical indication that the U.S. broad market outlook was in jeopardy, particularly when the 6-year cycle peaks later this summer.
The relative weakness in the bank stock composite also suggests that, due to the banks' continued exposure to bad housing market debts, the next leg of the real estate bear market has already begun. It has been camouflaged by the recent rally in the S&P 500 and also by the media's fixation on the upcoming debt ceiling vote. Once the smoke has cleared from this latest media frenzy, watch for more cracks to appear in the banking and real estate sectors in the months ahead.
The old consumer economy which flourished up until the bursting of the real estate bubble was based largely on indebtedness. This is where both the banks and the real estate industry came together to allow Americans to live beyond their means. For years, Americans relied on bank credit and home equity loans to finance their houses, cars, and other expenses - large and small - without giving much though on how their debt, and the interest on that debt, would be repaid. But now everyone is feeling the painful effects of those years of instant gratification that debt provided.
While Fed Chairman Bernanke and the cheerleaders of the government's stimulus efforts are pointing to the recent all-time high achieved in the Russell 2000 Small Cap Index as an indication of the success of QE2, another more reliable indicator paints a less promising picture. The long-term price graph of the Housing Sector Index (HGX), which is a composite of the leading homebuilding industry stocks, has made no meaningful recovery since peaking out in 2005. Instead, HGX has made a series of lower highs and lower lows, the classic pattern of a secular bear market. The following chart compares the price line of the HGX (blue line) with the S&P 500 Index (red line).
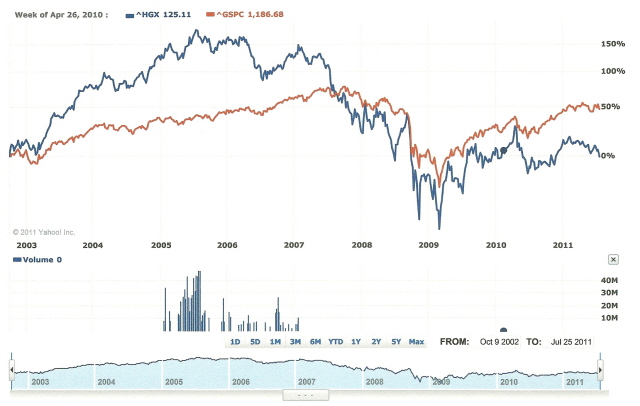
When you consider that the Housing Sector Index (HGX) preceded the S&P 500 Index (SPX) in confirming the last secular bull market back in 2002, and also was the first to confirm a long-term bull market peak in 2005 - fully two years ahead of the SPX - it's notable that HGX has refused to confirm the confirm the higher high in the SPX and other major indices this year. Instead, the rally off the 2009 lows in the HGX peaked in early 2010 (see chart) and the housing index has made a conspicuously lower high this year, which is ominous from a technical perspective.
The failure of the HGX to make a higher high on the back of the QE2-driven financial market momentum in late 2010 through the summer of 2011 is ominous for another reason. Just as the last bull market from 2003-2007 was built on the back of the real estate boom, and just as the credit crisis of 2007-2008 was preceded by a housing market bust, so too will the relative weakness of the housing sector eventually pull down the financial market and economic recover of the last two years once the residual momentum of QE2 fades away. With the important 6-year cycle scheduled to peak in late September this year (the last of the major yearly cycles in the 120-year Kress Cycle series), the financial market will lose yet another powerful support and will face major headwinds heading into 2012 and beyond as the powerful 120-year cycle descends into late 2014.
On a side note, as we head further into these economic headwinds the downward force exerted by the bottoming 120-year cycle should continue to lift the gold price. Gold continues to usurp the position of the most favored investment safe haven among small investors from traditional equities and real estate and should increase in this role as we head closer to the fateful year 2014.
Gold & Gold Stock Trading Simplified
With the long-term bull market in gold and mining stocks in full swing, there exist several fantastic opportunities for capturing profits and maximizing gains in the precious metals arena. Yet a common complaint is that small-to-medium sized traders have a hard time knowing when to buy and when to take profits. It doesn't matter when so many pundits dispense conflicting advice in the financial media. This amounts to "analysis into paralysis" and results in the typical investor being unable to "pull the trigger" on a trade when the right time comes to buy.
Not surprisingly, many traders and investors are looking for a reliable and easy-to-follow system for participating in the precious metals bull market. They want a system that allows them to enter without guesswork and one that gets them out at the appropriate time and without any undue risks. They also want a system that automatically takes profits at precise points along the way while adjusting the stop loss continuously so as to lock in gains and minimize potential losses from whipsaws.
In my latest book, "Gold & Gold Stock Trading Simplified," I remove the mystique behind gold and gold stock trading and reveal a completely simple and reliable system that allows the small-to-mid-size trader to profit from both up and down moves in the mining stock market. It's the same system that I use each day in the Gold & Silver Stock Report - the same system which has consistently generated profits for my subscribers and has kept them on the correct side of the gold and mining stock market for years. You won't find a more straight forward and easy-to-follow system that actually works than the one explained in "Gold & Gold Stock Trading Simplified."
The technical trading system revealed in "Gold & Gold Stock Trading Simplified" by itself is worth its weight in gold. Additionally, the book reveals several useful indicators that will increase your chances of scoring big profits in the mining stock sector. You'll learn when to use reliable leading indicators for predicting when the mining stocks are about o break out. After all, nothing beats being on the right side of a market move before the move gets underway.
The methods revealed in "Gold & Gold Stock Trading Simplified" are the product of several year's worth of writing, research and real time market trading/testing. It also contains the benefit of my 14 years worth of experience as a professional in the precious metals and PM mining share sector. The trading techniques discussed in the book have been carefully calibrated to match today's fast moving and volatile market environment. You won't find a more timely and useful book than this for capturing profits in today's gold and gold stock market.
The book is now available for sale at:
http://www.clifdroke.com/books/trading_simplified.html
Order today to receive your autographed copy and a FREE 1-month trial subscription to the Gold & Silver Stock Report newsletter. Published twice each week, the newsletter uses the method described in this book for making profitable trades among the actively traded gold mining shares.
By Clif Droke
www.clifdroke.com
Clif Droke is the editor of the daily Gold & Silver Stock Report. Published daily since 2002, the report provides forecasts and analysis of the leading gold, silver, uranium and energy stocks from a short-term technical standpoint. He is also the author of numerous books, including 'How to Read Chart Patterns for Greater Profits.' For more information visit www.clifdroke.com
Clif Droke Archive |
© 2005-2022 http://www.MarketOracle.co.uk - The Market Oracle is a FREE Daily Financial Markets Analysis & Forecasting online publication.