


Smallest Yield Curve Gap Between US and Japan in 19 Years Confirming Deflation
Interest-Rates / US Interest Rates Aug 16, 2011 - 06:24 AM GMTBy: Mike_Shedlock

 Curve Watchers Anonymous notes amazingly low yields across the entire yield curve for the US, Japan, Germany, and the UK. Here is a chart I put together this evening.
Yield Curve Comparison US, Japan, Germany, UK as of 2011-08-15
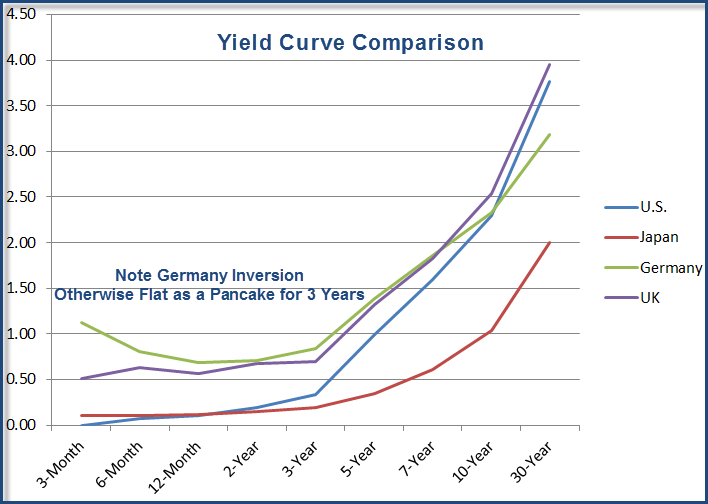
Data from Bloomberg Government Bonds as of 2011-08-15.
Mighty European Recession on the Way
Note the inversion in the German yield curve. Typically this means a recession is on the way, but the results may be skewed by all the EU bailout concerns.
Regardless, other data points especially falling industrial production also suggest Europe is headed for a recession. The austerity measures in Italy, Greece, Ireland, Spain, and Portugal will turn the recession into a mighty one.
Spain and Greece are clearly in recession now, the rest of Europe will soon follow (if it is not in recession already).
Elsewhere curves are flat as a pancake everywhere for three years. With both US and Japan flirting with zero for that three-year duration.
Smallest Yield Curve Gap Between US and Japan in 19 Years
Please consider Smallest Yield Gap in 19 Years Adds to Yen Struggle for Bank of Japan
The Bank of Japan, struggling to keep the strengthening yen from derailing efforts to repair the world’s third-largest economy, is facing a new challenge -- the shrinking yield gap between two-year sovereigns and Treasuries.
The extra yield two-year Treasuries offer over similar- maturity Japanese notes fell today to the least since 1992. BOJ Governor Masaaki Shirakawa said on Aug. 4 there’s a “relatively high” correlation between that rate gap and the dollar-yen rate, as falling yield premiums in the U.S. damp dollar-buying demand from Japanese investors.
The central bank may need to lengthen the maturity of bonds in its asset purchase program to stop the yen’s appreciation, according to Mizuho Securities Co. The BOJ, whose policy rate is already near zero, bolstered stimulus by 10 trillion yen ($130 billion) on Aug. 4, the same day Japan intervened in the currency market for the first time since March.
The difference between the U.S. and Japanese two-year yields narrowed to a 19-year low of 3.7 basis points today.
US Back in Deflation
For Japan and the US, these are deflationary curves. This is 1 of 14 signs the US is once again in deflation. Please see Yes Virginia, U.S. Back in Deflation; Inflation Scare Ends; Hyperinflationists Wrong Twice Over for additional details.
That said, this talk of the Bank of Japan going further out on the yield curve to suppress yields at the long end of the curve is sheer madness. Japan has been pursuing such policies for 20 years and has nothing to show for it. Worse yet, its fiscal policies fighting deflation has landed Japan the largest debt-to-GDP ratio in the world (of any major country).
Bernanke has not learned a thing from this. Bernanke wants Keynesian fiscal policies in Congress while he follows the Bank of Japan on monetary policy. It's sheer idiocy doing the same thing over and over hoping for a better result.
Turning Japanese
Barry Ritholtz has this interesting chart of SPX vs MSCI Japan Index (10 Year Lag)
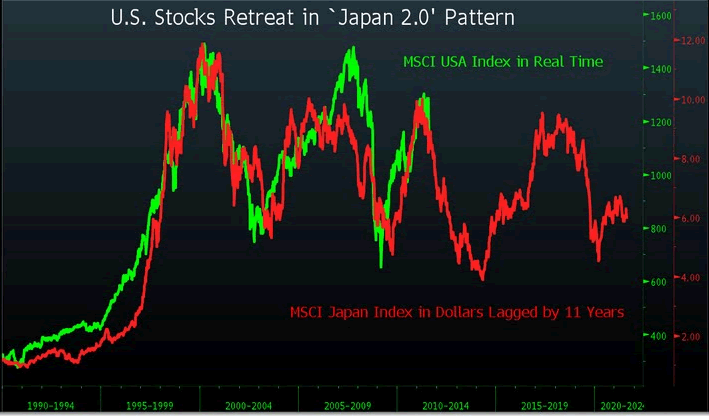
The past does not predict the future. However, please remain open to the possibility the US is following the footsteps of Japan in more ways than one.
Here is the table of values that make up the lead yield-curve chart.
US, Japan, Germany, UK Yield Curve Data Points
| Duration | U.S. | Japan | Germany | UK |
|---|---|---|---|---|
| 3-Month | 0.00 | 0.10 | 1.12 | 0.51 |
| 6-Month | 0.07 | 0.10 | 0.81 | 0.63 |
| 12-Month | 0.10 | 0.12 | 0.68 | 0.57 |
| 2-Year | 0.19 | 0.15 | 0.71 | 0.67 |
| 3-Year | 0.34 | 0.19 | 0.84 | 0.70 |
| 5-Year | 0.99 | 0.35 | 1.39 | 1.32 |
| 7-Year | 1.59 | 0.61 | 1.86 | 1.83 |
| 10-Year | 2.30 | 1.04 | 2.33 | 2.54 |
| 30-Year | 3.77 | 2.00 | 3.18 | 3.95 |
These data points are a sign of enormous global weakness. Those banking on a huge second-half recovery are doing more wishing than thinking.
By Mike "Mish" Shedlock
http://globaleconomicanalysis.blogspot.com Click Here To Scroll Thru My Recent Post List
Mike Shedlock / Mish is a registered investment advisor representative for SitkaPacific Capital Management . Sitka Pacific is an asset management firm whose goal is strong performance and low volatility, regardless of market direction.
Visit Sitka Pacific's Account Management Page to learn more about wealth management and capital preservation strategies of Sitka Pacific.
I do weekly podcasts every Thursday on HoweStreet and a brief 7 minute segment on Saturday on CKNW AM 980 in Vancouver.
When not writing about stocks or the economy I spends a great deal of time on photography and in the garden. I have over 80 magazine and book cover credits. Some of my Wisconsin and gardening images can be seen at MichaelShedlock.com .
© 2011 Mike Shedlock, All Rights Reserved.
© 2005-2022 http://www.MarketOracle.co.uk - The Market Oracle is a FREE Daily Financial Markets Analysis & Forecasting online publication.