The Fed’s Focus is on Economic Growth Not Inflation
Economics / Inflation Aug 19, 2011 - 01:17 AM GMTBy: Asha_Bangalore
 Of the several economic reports published this morning, existing home sales data of July and the August factory activity report of the Philadelphia Fed take precedence over the July Consumer Price Index because inflation is likely to moderate if weak economic conditions persist in the near term.
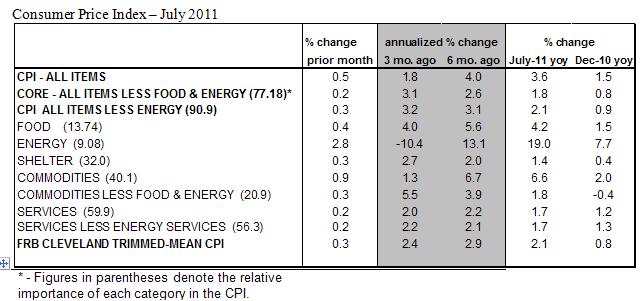
The Consumer Price Index (CPI) rose 0.5% in July after a 0.2% drop in the previous month. Higher prices for food, gasoline, rent, and clothing accounted for the jump in the CPI. Gasoline prices moved up 4.7% in July and accounted for about half of the increase of the CPI, according to the Bureau of Labor Statistics. The energy price index has risen 19% in the twelve months ended July. Food prices (+0.4%) also rose in July, putting the year-to-year increase at 4.2%. The all-items CPI has increased 3.6% in the last twelve months.
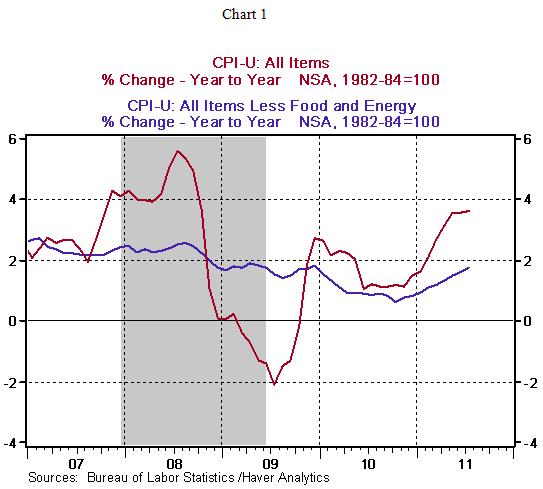
The core CPI, which excludes food and energy, increased 0.2%in July, which works out to a 1.8% increase during the past year. The year-to-year change in the core CPI bottomed out in October 2010 at 0.6% and has climbed steadily each month. Shelter costs posted year-to-year declined in2010 but have reversed this trend in 2011. The 0.3% increase in shelter costs reflects 0.3%gain in the index for rent and owners’ equivalent rent and a 0.9% jump in hotel prices. Clothing prices advanced 1.2% in July and put the year-to-year increase at 3.1%, the largest since 1992. Prices of new cars held stead, while that of used cars rose 0.7%. Airfares edged up 0.1%, tobacco prices rose 0.5%, and the medical care price index climbed 0.2%.
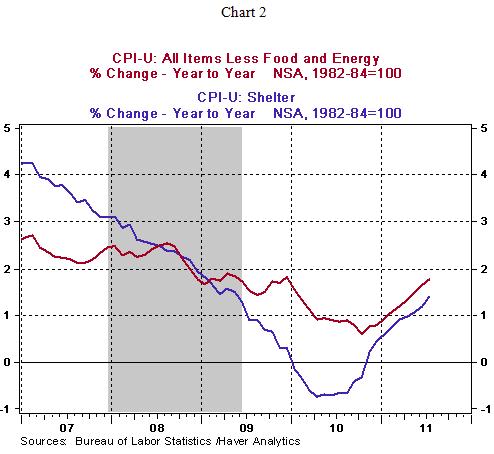
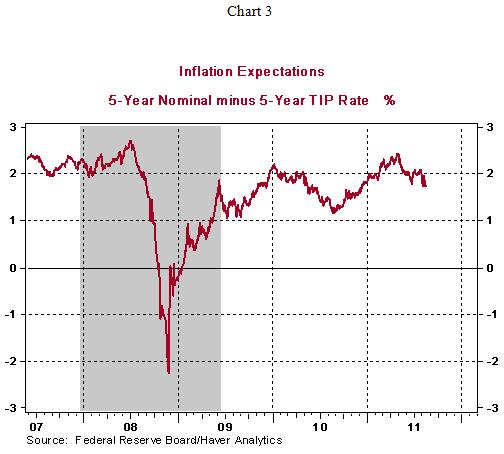
The Fed has indicated in the August 9 policy statement that the low interest rate environment would prevail until mid-2013. Despite this stance, the upward trend of shelter costs will be tracked closely. The weight of shelter costs in the personal consumption expenditure price index (the Fed’s preferred inflation measure) is smaller than the CPI. Nevertheless, an upward trend will be visible in this price measure also. A lower unemployment rate and stronger growth of the economy are the primary goals of the Fed at present. Projections of soft economic growth suggest that inflation readings should remain non-threatening. Inflation expectations for the medium term do not show a worrisome trend (see Chart 3).
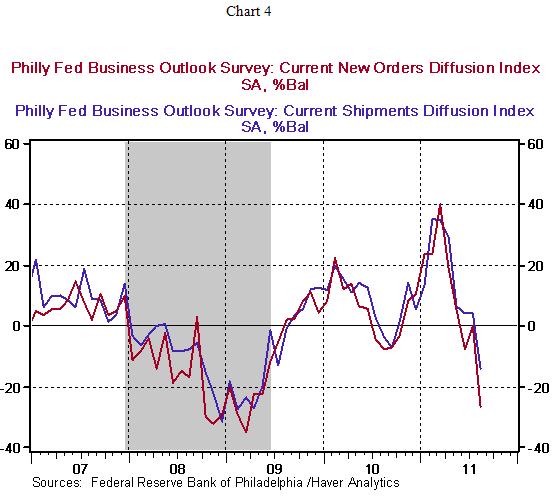
The Philadelphia Fed’s factory survey for August presents a severe loss of momentum in the region’s factory sector. The diffusion index of current activity fell to -30.7 in August from a positive reading of 3.2. Indexes tracking new orders (-26.8 vs. +0.1 in July) and shipments (-13.9 vs. +4.3 in July) fell to levels seen during the Great Recession (see Chart 4). The tone of the August report from the Philadelphia Fed suggests significantly weak factory conditions. It is noteworthy that the Philadelphia Fed President Plosser was one of the three dissenters at the August 9 FOMC meeting and would have preferred to leave the current understanding of “extended period” unchanged. The policy statement noted that low rates would prevail at the least until mid-2013 and thus redefined the meaning of extended period which typically stood for a time period covering 2-3 Fed meetings.
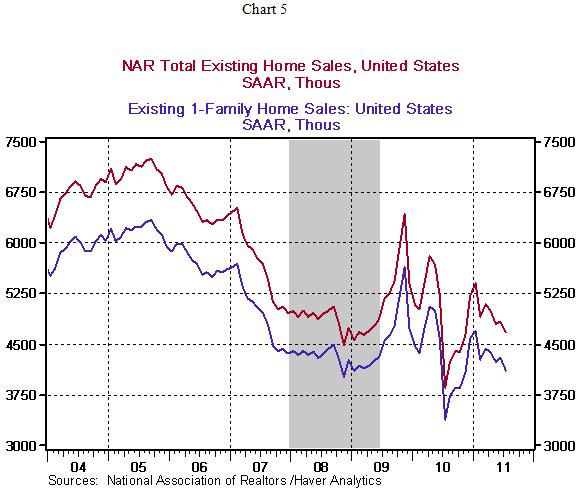
Sales of existing homes fell 4.7% to an annual rate of 4.67 million units in July, the third monthly drop in the last four months. Sales of single-family homes declined 4.0% to an annual rate of 4.12 million units. On a regional basis, sales of existing homes advanced in the Northeast (+2.7%) and Midwest (+1.0%) but dropped in the South (-1.6%) and West (-12.6%). Sales of existing homes show a year-to-year gain of 17.1% in July, which is exaggerated because purchases of existing homes had dropped in July 2010 following the expiry of the first-time home buyer program. Essentially, these metrics indicate that sales of existing homes have not posted a meaningful increase from the recession lows, as yet (see Chart 5)
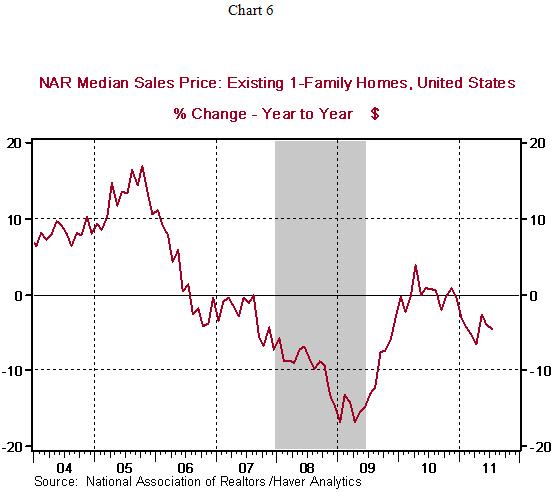
Prices of existing homes continue to show a downward trend. The median price of an existing single-family home ($174,800) dropped 4.5% from a year ago. The seasonally unadjusted inventory of unsold existing single-family homes has risen in July (9.4-month supply vs. 9.2-month supply in June). The large number of unsold homes and the availability of foreclosed homes are both playing a role in keeping prices of existing homes down.
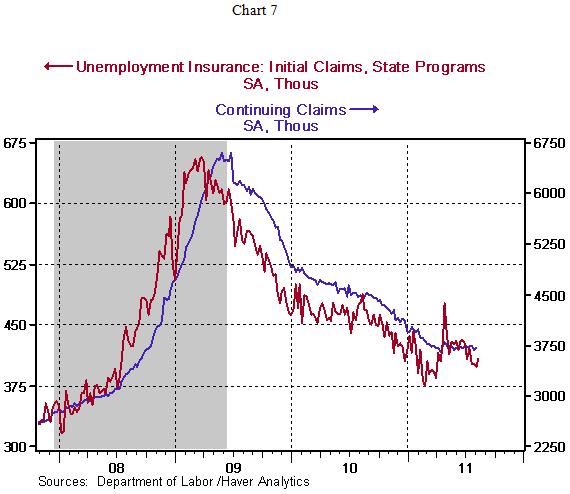
In other related news, initial jobless claims increased 9,000 to 408,000 during the week ended August 13. Continuing claims, which lag initial jobless claims by one week, rose 7,000 to 3.702 million. Jobless claims data continue to send a persistent message of weak conditions in the labor market.
Asha Bangalore — Senior Vice President and Economist
http://www.northerntrust.com
Asha Bangalore is Vice President and Economist at The Northern Trust Company, Chicago. Prior to joining the bank in 1994, she was Consultant to savings and loan institutions and commercial banks at Financial & Economic Strategies Corporation, Chicago.
Copyright © 2011 Asha Bangalore
The opinions expressed herein are those of the author and do not necessarily represent the views of The Northern Trust Company. The Northern Trust Company does not warrant the accuracy or completeness of information contained herein, such information is subject to change and is not intended to influence your investment decisions.
© 2005-2022 http://www.MarketOracle.co.uk - The Market Oracle is a FREE Daily Financial Markets Analysis & Forecasting online publication.


