FTSE 100 Forecast - Sell in May and Go Away !
Stock-Markets / UK Stock Market Apr 29, 2006 - 09:35 PM GMTBy: Nadeem_Walayat
 In a week that ended with the FTSE falling over 100 points from high of 6137, we revisit the age old adage of selling in May and go away !
As my analysis will show the market is now primed for a serious correction after fulfilling a years target in less than 4 months !

Sell in May and Go Away
The 6 months from 1st May to 31st Oct are usually the worst for the stock market, i.e. since 1965, returns for the FTSE All-Share index in the six summer months between April 30 and October 31 have averaged just 2.2%, whereas the period from 1st Nov to 30th April are usually the best, where returns have averaged 14.3% !
Looking at recent activity, clearly we have had the best !, with the FTSE rising from 5300 to a high of 6136, 836 points or 15.7% , right inline with the seasonal expectation !
Back on 31st December, I forecast a target high for the FTSE during 2006 of 6000, that has now been exceeded well before the year end and during the bullish stock market period. Now similarly I am anticipating a strong downswing that is likely to last some six months going into Late October 2006.
Technical Analysis
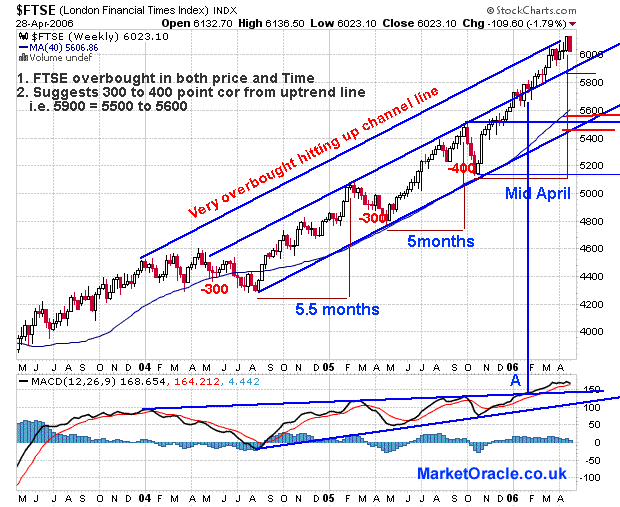
1. Resistance Line - At 6136, the FTSE is probably made its high for most of the year, and is now unlikely to break it until possibly the rally that takes place during the end of 2006, if at all !
2. Support - Key support lies along 5500, and is thus the natural target for any correction.
3. MACD - (Bottom indicator) - After breaking above the ascending triangle, during January, lead to a sharp rally in the FTSE, which has brought the FTSE to a very overbought state, and is screaming correction !, The most recent decline is creating a cross and thus a trigger for that correction to commence in the coming days, the target low for the correction would be to hit the lower support trend-line.
4. 40 week Moving Average - The moving average has proved very useful in containing corrections and thus implies a current target of some 5600,
5. Uptrend Line - Similar to the key support area along the previous high at 5,500, the main uptrendline cuts in currently at 5480 support area for the FTSE.
6. Time - The recent moves from Bottom to top have been in the order of 5 to 5.5 months, and thus suggest the FTSE is overbought also in time terms, and implies a lengthier correction time wise, of at least 1 month and probably much longer, which would suggest an ABC pattern to the correction, to stretch the correction out somewhat.
Target - Based on the above analysis the FTSE is targeting between 5600 and 5480, with the major support in the region of 5,520 and thus the strongest targeting price.
Time - Seasonal analysis suggests a trend that will likely to the FTSE into a low in late Sept / Early October 06, and thus implying an ABC pattern, i.e. after an initial decline to form wave A, a B wave rally with a final C wave decline to possibly new low for the move.
Stop-Loss - Clearly the stop loss should be above the high of 6136, say 6150. As a break of the high would imply a resumption of the uptrend.
Nadeem Walayat
(c) MarketOracle.co.uk 2005-2006
Disclaimer - This Forecast / Trade Scenerio is provided for general information purposes only and not a solicitation or recommendation to enter into any market position, and you are reminded to seek independent professional advice before entering into any investments or trading positions.The Market Oracle is a FREE Financial Markets Forecasting & Analysis online publication. We aim to cut through the noise cluttering traditional sources of market analysis and get to the key points of where the markets are at and where they are expected to move to next ! http://www.marketoracle.co.uk
This article maybe reproduced if reprinted in its entirety with links to http://www.marketoracle.co.uk
© 2005-2022 http://www.MarketOracle.co.uk - The Market Oracle is a FREE Daily Financial Markets Analysis & Forecasting online publication.


