


Another Stock Market "Lost Decade" Coming Up; Boomer Retirement Headwinds
Stock-Markets / Stocks Bear Market Aug 23, 2011 - 12:18 PM GMTBy: Mike_Shedlock

 Inquiring minds are digging into a Federal Reserve Bank of San Francisco report that models equity prices and P/E ratios based on demographics. The outlook is not promising to say the least.
Interestingly, the report matches articles I wrote earlier this year based on cycles, not demographics.
First let's take a look at the Fed report, then another look at my previous articles on P/E expansion and contraction followed by a new chart that suggests another "lost decade" is in progress right now.
Please consider Boomer Retirement: Headwinds for U.S. Equity Markets?
Historical data indicate a strong relationship between the age distribution of the U.S. population and stock market performance. A key demographic trend is the aging of the baby boom generation. As they reach retirement age, they are likely to shift from buying stocks to selling their equity holdings to finance retirement. Statistical models suggest that this shift could be a factor holding down equity valuations over the next two decades.
Demographic trends and stock prices: Some evidence
To examine the historical relationship between demographic trends and stock prices, we consider a statistical model in which the equity price/earnings (P/E) ratio depends on a measure of age distribution.
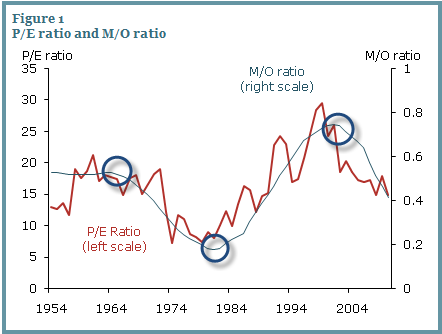
We construct the P/E ratio based on the year-end level of the Standard & Poor’s 500 Index adjusted for inflation and average inflation-adjusted earnings over the past 12 months. We measure age distribution using the ratio of the middle-age cohort, age 40–49, to the old-age cohort, age 60–69. We call this the M/O ratio.
Figure 1 displays the P/E and M/O ratios from 1954 to 2010. The two series appear to be highly correlated. [Circles added by Mish for later reference]
Between 1981 and 2000, as baby boomers reached their peak working and saving ages, the M/O ratio increased from about 0.18 to about 0.74. During the same period, the P/E ratio tripled from about 8 to 24. In the 2000s, as the baby boom generation started aging and the baby bust generation started to reach prime working and saving ages, the M/O and P/E ratios both declined substantially. Statistical analysis confirms this correlation. In our model, we obtain a statistically and economically significant estimate of the relationship between the P/E and M/O ratios. We estimate that the M/O ratio explains about 61% of the movements in the P/E ratio during the sample period. In other words, the M/O ratio predicts long-run trends in the P/E ratio well.
Demographic headwinds for U.S. stock prices
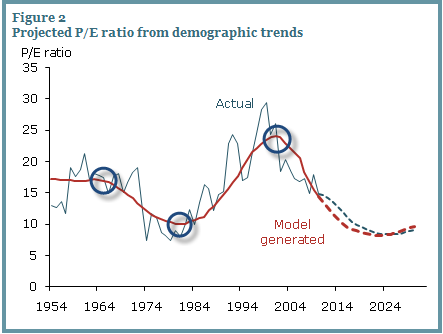
This evidence suggests that U.S. equity values are closely related to the age distribution of the population. Since demographic trends are largely predictable, we can forecast the path that the P/E ratio is likely to follow in the next few decades based on the predicted M/O ratio. Figure 2 compares the actual and model-implied P/E ratios for the sample period ending in 2010. We calculate the path for the model-implied P/E during the sample period by feeding in actual M/O ratios. We call the long-run path of the P/E ratio predicted by the model the “potential P/E ratio” and designate it P/E*. Figure 2 shows that the P/E* (red dashed line) is highly correlated with actual P/E during the sample period.
To generate a forecast for actual P/E from 2011 to 2030, we must first project P/E* for that period. To obtain this future P/E* path, we calculate the projected M/O ratio from 2011 to 2030 by feeding Census Bureau projected population data into the estimated model. Figure 2 shows that P/E* should decline persistently from about 15 in 2010 to about 8.4 in 2025, before recovering to 9.14 in 2030.
We are also interested in forecasting the potential path for stock prices. Since we have forecast a path for the P/E ratio, predicting stock prices is straightforward if we can project earnings, the E part of the ratio. For this purpose, we assume that, in the next decade, real earnings will grow steadily at the same average 3.42% annual rate by which they grew from 1954 to 2010. To obtain real earnings, we deflate nominal earnings by the consumer price index.
The model-generated path for real stock prices implied by demographic trends is quite bearish. Real stock prices follow a downward trend until 2021, cumulatively declining about 13% relative to 2010. The subsequent recovery is quite slow. Indeed, real stock prices are not expected to return to their 2010 level until 2027. On the brighter side, as the M/O ratio rebounds in 2025, we should expect a strong stock price recovery. By 2030, our calculations suggest that the real value of equities will be about 20% higher than in 2010.P/E Expansion and Contraction Drive Share Prices Not Earnings
Figure 2 above ought to scare the daylights out of long-term buy-and-hold types because it is expansion and contraction of P/Es that most determines share prices, not earnings.
I covered that idea in depth in Negative Annualized Stock Market Returns for the Next 10 Years or Longer? It's Far More Likely Than You Think.
I used Crestmont's matrix S&P 500 Nominal Returns + Dividends as the starting point for the following tables and analysis.There is much more in the above article including a look at fundamental reasons why valuations are currently stretched far beyond what analysts tell you. Please take a look if you have not done so already.
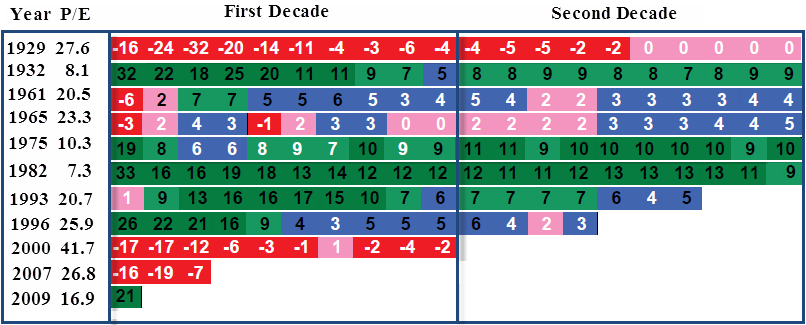
The table below shows a sampling of years (some high valuation years and some low) along with annualized returns for two decades.
Annualized Rates of Return for Select Years
Note how much the starting PE valuation matters. Someone who started investing in 1929 received an annualized rate-of-return of 0% for two full decades, even if they religiously reinvested dividends every year.
However, someone investing in 1982 received an excellent annualized rate-of-return for two full decades (12% for the first decade and 9% annualized for 20 years).
Note year 2000. Starting valuations were the highest in history. It should not have been a surprise to discover that 10 years later, the annualized rate-of-return was -2%.
Bear in mind, the Case-Shiller normalized PE for the year ending 2010 is 23. Does that bode well for the next decade?
Of course no one knows what this year or next year will bring.
Take a look at 1996 in the above table. In spite of several years of huge stock market gains, the annualized rate-of-return to date sits at 3.
Cycles of PE Compression and Expansion
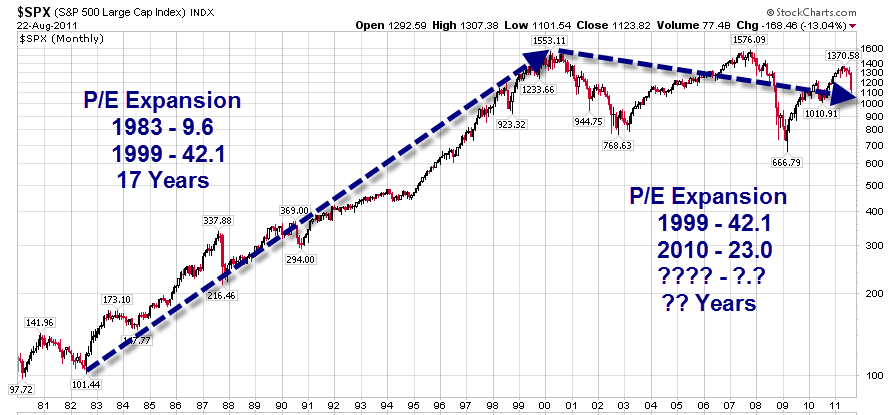
Over long periods of time PE ratios tend to compress and expand. Unless "it's different this time", history says that we are in a secular downtrend in PEs. From 1983 until 2000, investors had the tailwinds PE expansion at their back. Since 2000, PEs fluctuated but the stock market never returned to valuations that typically mark a bear market bottom.
Moreover, demographically speaking, the current decade not only starts with very rich valuations, but also comes at a time when peak earnings of boomers have passed. Those boomers are now heading into retirement and will need to draw down savings, not accumulate large houses and more toys.
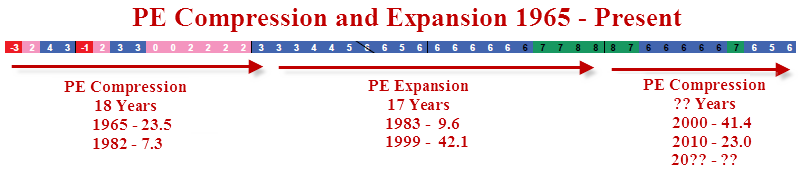
PE Compression and Expansion 1965 - Present
Also take a good look at that P/E Compression Expansion Chart 1965 to Present and compare to the charts by the San Francisco Fed.
The P/E ratios will not exactly match because I use normalized earnings but the time periods match and the overall trends match as well.
Starting in 1965 there was P/E compression for 18 years. Staring in 1983 there was P/E expansion for 17 years. That marked capped the biggest bull market in history.
Now What?
My model suggests 17-18 years of P/E compression. The Fed article suggests even longer! If so, where are stock prices headed?
Bear in mind, I do not subscribe to the San Francisco Fed idea "real earnings will grow steadily at the same average 3.42% annual rate by which they grew from 1954 to 2010".
We are in the midst of a massive debt-deflation cycle similar to the one that has plagued Japan for over two decades. There is no reason to expect earnings growth to match prior averages.
Value Traps
Not only will we be in a lengthy period of P/E compression, debt-deflation and related issues suggest earnings will compress as well.
This compounds greatly the "Value Trap" problem I have mentioned several times recently, notably Value Traps Galore (Including Financials and Berkshire); Dead Money for a Decade.
Here is the conclusion of "Negative Annualized Stock Market Returns for the Next 10 Years or Longer? It's Far More Likely Than You Think"
Where to From Here?That was written in February 2011. At the time, and for the next couple months I received many emails from people who feared being out of the market.
Hopefully you now realize that expectations of rising earnings being tremendous for the stock market is a fallacious construct. Such talk ignores high valuations, the long-term trend in valuations, and demographics. Moreover, it's debatable if earnings are likely to rise in the first place.
With that in mind, people chasing this market as well as those fully invested do not realize how lucky they have been.
Last week I received an email from someone who fears being out the market. I heard the same thing in 2007. I suggest people ought to fear being fully invested with no hedges. The same applies to pension funds. Note that most pension plan assumptions are on the order of 8% annualized rates-of return, and pension funds are typically 100% invested, 100% of the time.
However, I do not know where the market is headed this year, nor does anyone else. 2011 may turn out like 1998 or it may turn out like 2008.
Either way, history strongly suggests that 10-year and 20-year returns looking ahead are likely to be low, if not negative.
Investing, like life, is a marathon not a sprint. Sometimes the prudent thing to do is sit on the sidelines waiting for better opportunities, even if it means enduring cat-calls and taunts from those who do not have any understanding of risk or history.
Given valuations, demographics, and trends in P/E compression, the fear should be about being in this market unhedged, not being out of it.
As noted by me previously, and now by the San Francisco Fed, this sorry state of affairs could last for years. Alternatively, stocks might crash once again to get to more reasonable valuations.
Either way, the picture is not pretty for those following buy-hold-and-forget-about-it strategies. Someone retiring now does not have until 2027 (the Fed's prediction), to get back to even.
By Mike "Mish" Shedlock
http://globaleconomicanalysis.blogspot.com Click Here To Scroll Thru My Recent Post List
Mike Shedlock / Mish is a registered investment advisor representative for SitkaPacific Capital Management . Sitka Pacific is an asset management firm whose goal is strong performance and low volatility, regardless of market direction.
Visit Sitka Pacific's Account Management Page to learn more about wealth management and capital preservation strategies of Sitka Pacific.
I do weekly podcasts every Thursday on HoweStreet and a brief 7 minute segment on Saturday on CKNW AM 980 in Vancouver.
When not writing about stocks or the economy I spends a great deal of time on photography and in the garden. I have over 80 magazine and book cover credits. Some of my Wisconsin and gardening images can be seen at MichaelShedlock.com .
© 2011 Mike Shedlock, All Rights Reserved.
© 2005-2022 http://www.MarketOracle.co.uk - The Market Oracle is a FREE Daily Financial Markets Analysis & Forecasting online publication.