


Stocks Primary Bear Market Dow Theory Update
Stock-Markets / Dow Theory Aug 28, 2011 - 01:55 AM GMTBy: Tim_Wood

 In accordance with Dow theory, once the trend is confirmed, that trend must be considered intact until it is authoritatively reversed. In the case of an up market, a move below the previous secondary low points are required in order to authoritatively reverse the uptrend and confirm a new downturn. On August 4, 2011 both the Industrials and the Transports closed below their previous secondary low points. In doing so, the bullish primary trend that began at the March 2009 low was reversed with a bearish primary trend change in accordance with classical Dow theory.
I have seen it written that once a Dow theory so-called "sell signal" occurs, it is an ominous sign for the market in that it sets the longer-term trend. In reality, if we actually study the Dow theory, history shows us that this is not always true. While I value Dow theory, it is not the whole story and based on other technical factors, which I will not get into here, the evidence tells me that this is apt to be one of those times in which the Dow theory trend change, which is mistakenly referred to as a "sell signal," is not likely to be so ominous. The details of this are outside of the scope of this article and are covered in detail in my research letters. Anyway, the point here is that we have two opposing forces at play. On the one hand, if we look only at orthodox Dow theory, we no doubt have a bona fide primary bearish trend change in place. However, when I look at other technical studies, I question this bearish trend change.
Now, with this all said, my longer-term view has not changed in the least. I continue to believe that the rally out of the March 2009 low is a bear market rally that should ultimately prove to separate Phase I from Phase II of a longer-term secular bear market. I also continue to believe that once this rally concludes and the decline into the Phase II low does begin, that decline will be far worse than what was seen in 2008 and into the March 2009 low. This also fits from a longer-term Dow theory phasing perspective because history shows that Phase II declines are the most devastating.
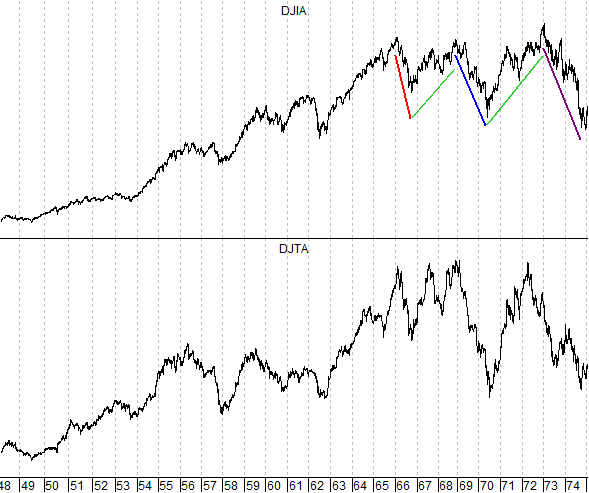
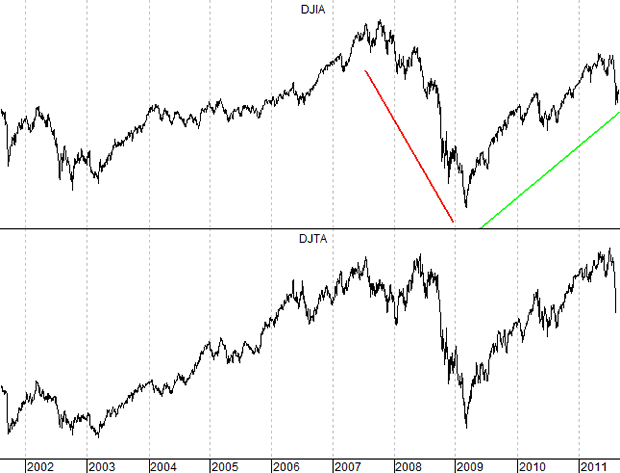
Also, my view that we are operating in an environment much like that of the 1966 to 1974 secular bear market, with the advance out of the 1966 Phase I low being similar in nature to the rally out of the 2009 low has not changed either. Please see the charts at the end of this article for comparison. This period is however proportionally larger than that of 1966 to 1974. Reason being, the bull market that preceded this bear market was longer in duration.
Let me explain. As I read about the bull and bear markets of the late 1800's and very early 1900's, it becomes apparent that the secular bull markets, in accordance with Dow theory, that Dow, Hamilton and Rhea wrote about were the upward movements of the 4-year cycle and the bear markets were the downward movements of the 4-year cycle. As our country grew, more and more people began investing and as a result the bull and bear periods became longer. As a result, bull and bear markets evolved into a series of multiple 4-year cycle periods. For example, the first bull market to consist of multiple 4-year cycles ran from 1921 to 1929 and consisted of two 4-year cycles. The low in November 1929 was a 4-year cycle low. The rally, or "secondary reaction," that followed was the upside of a 4-year cycle that topped in only 5 months. Once this secondary reaction was over, the DJIA moved down below the previous 4-year cycle low and into the 1932 4-year cycle low, which proved to be the bear market bottom. I would also like to point out that the 1921 to 1929 bull market advanced a total of 568% from the 1921 4-year cycle low at 67 on the DJIA to the 1929 4-year cycle top at a high of 381 on the DJIA.
The next great bull market began with the 4-year cycle low in 1942 and ran to the 4-year cycle top in 1966. This time the "primary" bull market was comprised of a series of six 4-year cycles and advanced a total of 1,076% from the 1942 4-year cycle low at 93 on the DJIA to the 1966 4-year cycle top at a high of 1,001 on the DJIA. Note, that this bull market advance was roughly double the preceding great bull market. The bear market that followed was also a series of 4-year cycles. From the 1966 4-year cycle top, the bear market moved down into the 1974 bear market low. This was a series of two 4-year cycles.
Now, I want to focus on the bear market declines. Prior to the first great bull market that ran between 1921 and 1929, the bear markets averaged some one-third the duration of the previous bull market. This relationship has also held true with the extended bull market periods as well. For example, the 1921 to 1929 bull market was 8 years in duration and the 1929 to 1932 bear market was 3 years, making the bear market duration 37.5% of the preceding bull market. The 1942 to 1966 bull market was 24 years in duration and the 1966 to 1974 bear market was 8 years, which was 33.3% of the duration of the preceding bull market.
From a cyclical perspective, the last and greatest bull market of all time began with the 1974 4-year cycle low. Some say that it began at the 1982 low and I understand that argument. However, from a cyclical and even a Dow theory perspective the bull market began in 1974 and this was the actual low point of the 1966 to 1974 bear market. 1982 was when the bull market broke out and became apparent.
At the 2000 top, the Dow theory non-confirmation and confirmed primary trend change indicated at the time that this great bull market era had ended. Upon the primary trend confirmation in March 2000, all indications, according to Dow theory phasing, were that Phase I of the great bear market had begun. Also, based upon the historical relationships between bull and bear markets that bear market was slated to run into the 2008 to 2010 timeframe, which was 33 to 37% of the preceding bull market. Again, when the rally out of the 2002 low began it appeared that this was simply the rally separating Phase I from Phase II of the bear market.
However, the powers that be threw everything they had at the market and in doing so they allowed the bear to claw its way out of existence and when both averages managed to better their 2000 highs, everything changed in accordance with the Dow theory phasing. I said at that time "I can tell you that this confirmation does not signal a "new" bull market, but rather reconfirms the existing bull market." What I was saying here in early 2007 was that the bull market that began in 1974 was reconfirmed as still being intact when both averages jointly bettered their 2000 highs and that we had never entered into a true bear market. This was written in an article on February 29, 2007.
Anyway, the advance that followed this reconfirmation carried the averages up into a joint high in July 2007. From that high a Dow theory non-confirmation was born and we all know what followed into the 2009 low. More importantly the DNA Markers that have been seen at all major tops since 1896 also appeared in conjunction with the 2007 top. It will again be these same DNA Markers that will eventually cap this bear market rally.
The bull market advance that began in 1974 ran 33 years and consisted of eight 4-year cycles with a total advance of 2,385%. Note that this advance has been roughly double the previous bull market advance, in terms of the percentage move out of the low in which the bull market began. At present, we are seeing the ongoing rally that should prove to separate Phase I from Phase II of what should prove to be a bear market of approximately 10 to 12 years duration. To think that a 33-year bull market was corrected in a mere 17 months simply has no historical basis. Based on the historical bull and bear market relationships, this bear market is expected to run some 33 to 37 percent of the duration of the preceding bull market. If so, with the bull market having lasted some 33 years in duration, a typical bear market relationship would last some 10 to 12 years, which, based upon the 2007 top, would take such a decline into 2017 to 2019. There are also other aspects of bull and bear markets including values.
So, it is because of the fact that the preceding bull market, that peaked at the 2007 top, ran some 33 years, as opposed to the 24 year bull market that preceded the 1966 top, that this bear market is expected to also be proportionally longer in duration and that the 2009 low should not have marked THE bear market bottom. I said all this to make the point that my longer-term view has not changed in the least and why. Thus, longer-term, I am still bearish. But, at this time, in spite of the fact that we have had an orthodox Dow theory primary trend change, I'm not convinced that the bear market rally is done.
I have begun doing free market commentary that is available at www.cyclesman.info/Articles.htm The specifics on Dow theory, my statistics, model expectations, and timing are available through a subscription to Cycles News & Views and the short-term updates. I have gone back to the inception of the Dow Jones Industrial Average in 1896 and identified the common traits associated with all major market tops. Thus, I know with a high degree of probability what this bear market rally top will look like and how to identify it. These details are covered in the monthly research letters as it unfolds. I also provide important turn point analysis using the unique Cycle Turn Indicator on the stock market, the dollar, bonds, gold, silver, oil, gasoline, the XAU and more. A subscription includes access to the monthly issues of Cycles News & Views covering the Dow theory, and very detailed statistical-based analysis plus updates 3 times a week.
By Tim Wood
Cyclesman.com
© 2011 Cycles News & Views; All Rights Reserved
Tim Wood specialises in Dow Theory and Cycles Analysis - Should you be interested in analysis that provides intermediate-term turn points utilizing the Cycle Turn Indicator as well as coverage on the Dow theory, other price quantification methods and all the statistical data surrounding the 4-year cycle, then please visit www.cyclesman.com for more details. A subscription includes access to the monthly issues of Cycles News & Views covering the stock market, the dollar, bonds and gold. I also cover other areas of interest at important turn points such as gasoline, oil, silver, the XAU and recently I have even covered corn. I also provide updates 3 times a week plus additional weekend updates on the Cycle Turn Indicator on most all areas of concern. I also give specific expectations for turn points of the short, intermediate and longer-term cycles based on historical quantification.
Tim Wood Archive |
© 2005-2022 http://www.MarketOracle.co.uk - The Market Oracle is a FREE Daily Financial Markets Analysis & Forecasting online publication.