Why the Euro is Not a Good Short
Currencies / Euro Aug 30, 2011 - 03:57 AM GMTBy: Capital3X
 No matter how bad the situation in EU zone is, the current price action is speaking a different language. Euro is not a good short at these levels. On the contrary, EUR/USD and EUR/GBP are building up a tremendous consolidation last seen probably in 2007. We know what happened then as it broke away to hit all time highs at 1.62. We are not saying it will do so now but the case to do so exists.
Please note that this is a medium term analysis 3-6 month view. This is not a day trading analysis. We post our day trading in our premium section at our site http://capital3x.com
After being dot on trades on MS and APPLE, we put out the latest analysis on the EURO. No better time than when the analyst community is split midway on which is worse: Dollar or EURO?
We use advanced indicators and internal indicators to judge on the EURO. These are the same parameters that allowed our premium subscribers to short MS on 1st Aug 2011 to make a 27% return. Summing all of August, the Capital3x portfolio is now up +1100 pips in profit after July when the total Net pips were +1021 pips.
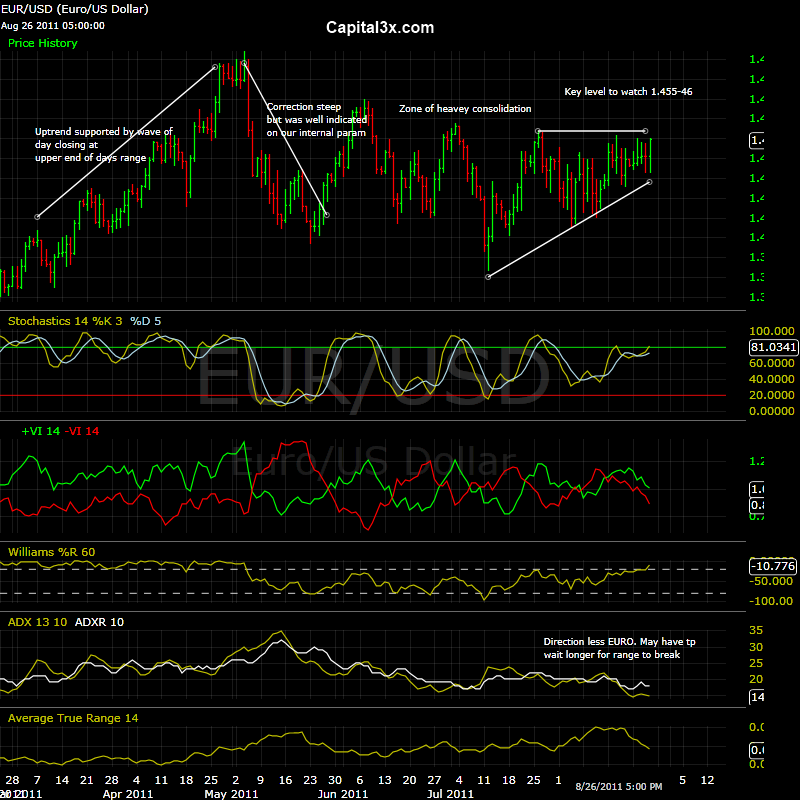
The following is euro chart as it stands on 26 Aug 2011:

The daily charts on EUR/USD is making a very strong case for a major upswing in the euro esp against the dollar:
- The daily stochastic are building into a strong 81 levels. Our readers will know that stochastic are the best tools available to measure the strength of any build up of moves on either side. They measure the index of the days on which the euro has closed at the upper end of its day range. A level of 81 is indicating developing strength.
- Direction indicators are still lagging and are not pointing to directional movements.
- Vortex Indicators are pointing to sustained up move. The +vortex has broken over the -vortex but since then has fallen away a bit even while maintaining its gain over the -vortex.
The key levels to watch on the upside is 1.4550-.46. A break even on intra day will see some major moves being suggested by the stochastic. Until then we believe EUR/USD is a prime candidate for 70-150 pips move daily and to the delight of day traders.
Even more critical are the charts of EUR/GBP and EUR/JPY both of which are affirming the strength of EURO. Therefore we do not think the eur/usd strength is mere case of dollar weakness.
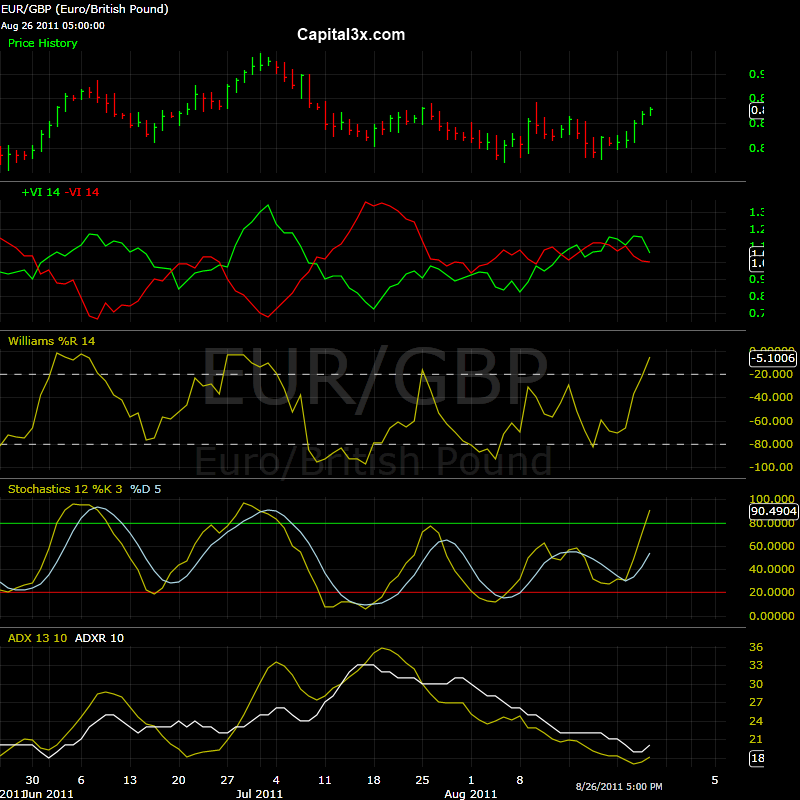
EUR/GBP Daily charts:

Stochastic have crossed 80, sign of ensuing strength. Vortex has been whipsawing but the possitive Vortex has been greater than the negative vortex by a marginal number.The level to watch for 0.8940-.90. Any move above these level will then confirm the sustained strength in euro against sterling.
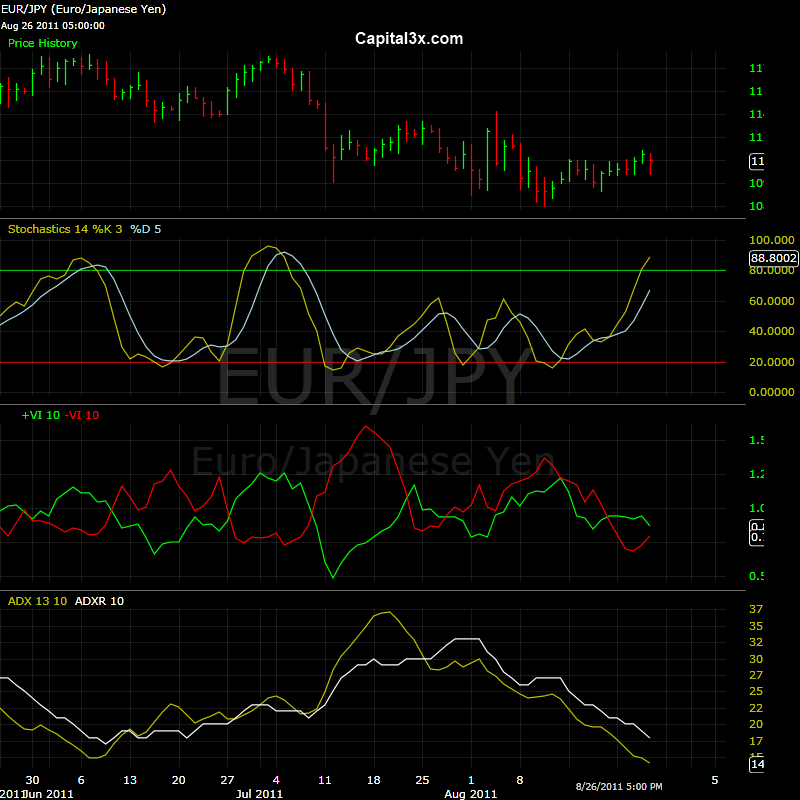
EUR/JPY daily charts

The EUR/JPY charts are incredibly important to understand the strength in euro. The stochastic are indicating 80 levels, a sign of strength in euro.
Given both EUR/JPY and EUR/GBP charts confirming the strength in euro, we will come out with new trades for next week. Our currency trades are normally short trades and will take advantage of day trading setups rather than long term indicators and patterns.
An important note to our day trader subscribers: The charts above are indicating a general trend in the medium term. These should not used for short term trades. We post short term trades on a daily basis.
On the fundamentals, euro is being whipsawed by news flow from Germany and the rest of Europe. Purely based on the health of EU nations debt position, euro should have been closer to parity, if at all it made a case to be existing in the form today.
- EUROBONDS without Germany can be a reality
- Premium of 89 bps over German bunds indicate that EUROBONDS may not be easy
- Greece wants to give private collateral to some nations: Germany says NO!
- And to all Europeans and US: The Sumerian Amargi
The latest news is sure to add to the optimism around euro, no matter how wrong they may be in the long run. Monday’s merger of Eurobank EFG and Alpha Bank sent shares in every Greek bank up about 30 percent. The EFG/Alpha solution creates a huge buffer by raising 3.9 billion euros of new capital by selling assets and selling new stock, among other means. If successful, the new entity will have a 14 percent core Tier 1 capital ratio, giving it more than enough of a cushion to absorb the 21 percent haircut on Greek debt envisaged by the July deal.
But even this deal will not take away the fact that Greece is wafer thin from declaring bankruptcy and it is only innovatice schemes that keep it going. As traders, though we dont care what is the news item. We trade the price action.
Given the fundamentals weighing on EURO, it is a remarkable reality that EUR/USD still holds on and to the irony and mystery, euro is building some steam indicated on the stochastic daily charts.
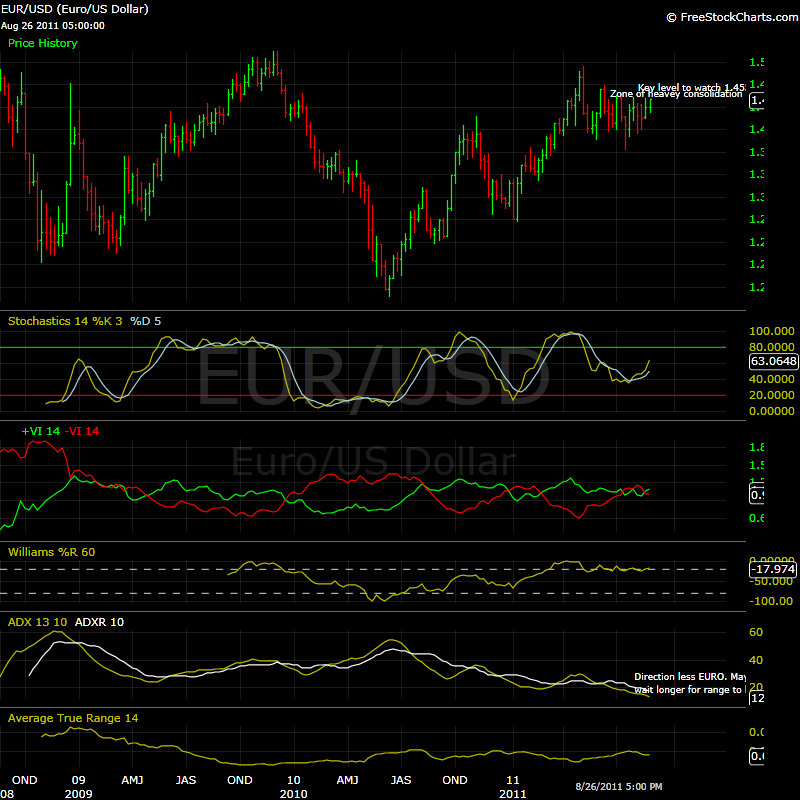
On the weekly charts, EUR/USD charts look less bullish with all parameters still building steam. They have not moved into a zone where as a trader one can risk large amounts. The stochastic are at a respectable 63 level. But we also note that on weekly charts, stochastic only reach a point of *buy* only after the daily charts have moved into strong buy zone.
EUR/USD weekly charts

As noted by the falling Average true range (ATR), euro volatility has been steadily falling even with the increasingly fragile state of EU zone member states economic state.
We believe that either a major reform is in the making in the EU zone (either in form of eurobonds or consolidation) which has not yet come out or the Chinese are buying EURO at breakneck speed. We do not know. But the charts and price action is pointing to some level of stability in EURO index in the next few weeks.
But having said that, charts and trends can change and therefore we will keep our premium subscribers posted.
Any change to charts will be posted.
Our feeds: RSS feed
Our Twitter: Follow Us
Kate
Capital3x.com
Kate, trading experience with PIMCO, now manage capital3x.com. Check performance before you subscribe.
© 2011 Copyright Capital3X - All Rights Reserved
Disclaimer: The above is a matter of opinion provided for general information purposes only and is not intended as investment advice. Information and analysis above are derived from sources and utilising methods believed to be reliable, but we cannot accept responsibility for any losses you may incur as a result of this analysis. Individuals should consult with their personal financial advisors.
© 2005-2022 http://www.MarketOracle.co.uk - The Market Oracle is a FREE Daily Financial Markets Analysis & Forecasting online publication.


