No Gold Summer Doldrums, End of Action for Mining Stocks?
Commodities / Gold and Silver 2011 Sep 03, 2011 - 03:13 PM GMT This will be an August to remember – no summer “dulldrums” this year. Gold has risen roughly 12% this month and nearly 30% year to date. Gold prices had a trading range of more than $300 in August.
Stocks are a different story. Wall Street ended the month with losses that came with an extended rout the first three weeks, with the current batch of gains only denting the damage. Since the start of July the FTSE 100 has lost 10.6%. The S&P is down 8.2%. The NIKKEI 225 has lost 8.8%, while the German DAX has plunged 22.6%. By contrast, gold prices have gained nearly 23% over the same period.
September is supposed to be the worst month on the calendar for stocks with losses averaging up to 1.2%, which, after a lousy August, does not bode well. By contrast, physical demand is likely to be strong for gold in the coming months due to expected strong buying from India, the world's largest gold market as the country begins its annual festival season.
Tuesday the price of gold price leapt 2.2% in less than an hour hitting $1832 per ounce - still 4.2% off last week's all-time high of $1,917.90. Gold rose on speculation that the Federal Reserve will further ease monetary policy to stimulate the economy. Minutes of the Fed meeting showed that a few members of the rate-setting committee “felt that recent economic developments justified a more substantial move” beyond the central bank’s Aug. 9 pledge to keep borrowing costs at a record low until mid-2013. This bias on the part of some Fed officials toward providing more easing was due to deep concern about the long-term unemployment.
Chicago Fed President Charles Evans said Tuesday in an interview that “We need to do more.” Just that statement was worth $38.20 in the price of gold. This is after Fed Chairman Ben S. Bernanke refrained from announcing additional stimulus last Friday at a meeting of central bankers in Jackson Hole, Wyoming.
Wednesday gold futures fluctuated between small gains and losses keeping above the psychologically important $1,800-an-ounce mark.
Gold has risen roughly 12% so far this month and nearly 30% year to date. At its record high on Aug. 23, the spot price of gold was up 18% from the beginning of August and 35% year to date. It dropped 11% to just over $1,700 within two days of hitting the high. This was no big surprise if you had considered what we had written on August 16th in our essay on top in gold:
(…) the overbought situation comes at a time when price levels are at or near very strong long-term resistance lines. It does appear that we are quite close to an important top (…) and long positions in gold at this point seem very risky at least for the short term.
Although plunges can be scary, it gives one perspective when you consider that the correction took gold no lower than it had been trading just two weeks earlier.
If your curiosity is aroused by what might happen during the following week, we’ll begin this week's technical part with the analysis of the XAU Index. We will start with the long-term chart (charts courtesy by http://stockcharts.com.)

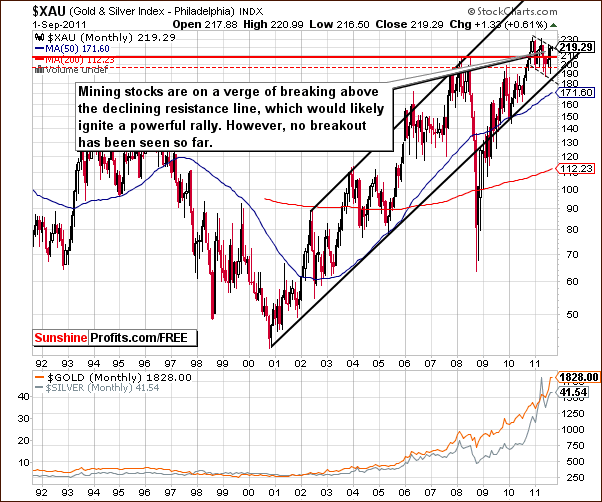
In this week’s very long-term XAU Gold and Silver Index chart, we have a situation which is quite mixed once again. The sideways price movement has been seen since late 2010 and attempts to move above the level of previous highs continue to be seen. A powerful rally would likely follow if this move is seen but our skepticism continues until such a breakout is seen.

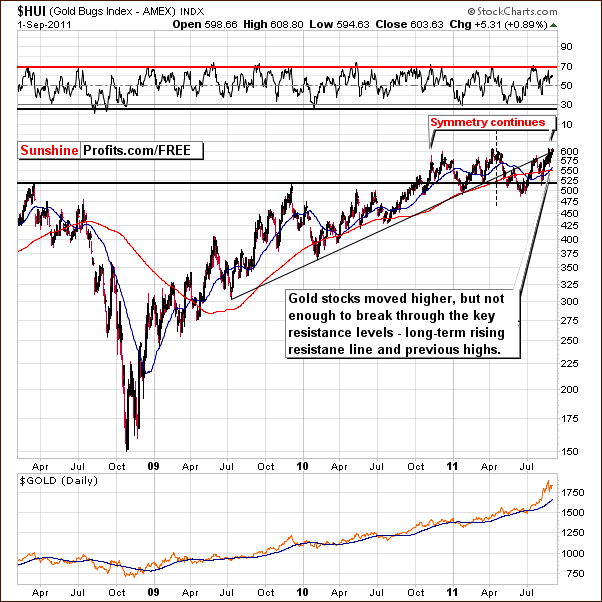
In this week’s long-term HUI Index chart, we did not see the plunge which would be in perfect tune with the symmetric pattern. However, this symmetry does not have to be perfect. The single spike high did not appear as in the past, but if gold stocks decline from here, the price action will still be similar to the previous decline. Based on this chart alone, the situation is bearish as no breakout has been seen and the basic symmetric pattern is still in place to some extent.

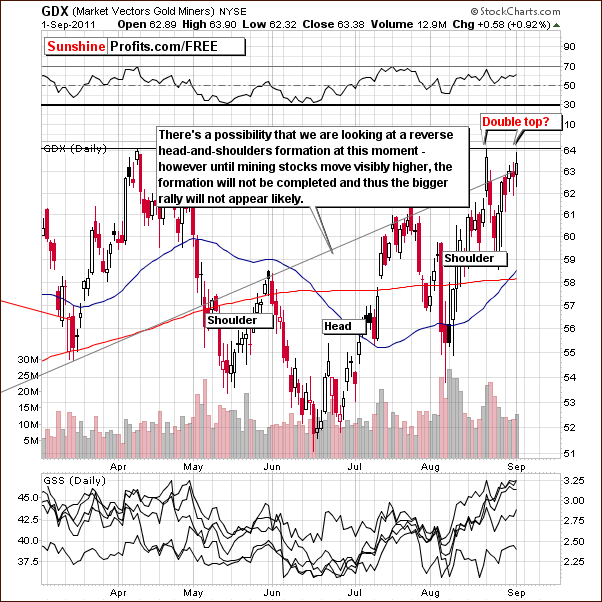
In this week’s short-term GDX ETF chart, we actually see some bullish price pattern in the form of a reverse head-and-shoulders formation. If this pattern is completed, it will likely lead to much higher prices but we would need to see gold’s stocks move above previous highs and verify the breakout.
Based on this chart alone, a rally appears likely due to the recent trading pattern. However, there is also a possibility that we are seeing a double top right now. We are truly at a crossroads and the breakout or breakdown which is yet to come will likely determine a much bigger move in the same direction.
Summing up, the situation for mining stocks is mixed overall. The recent move to previous highs is bullish since the underlying metals did not follow or lead the mining stocks. A truly bullish situation would be a move above previous highs here and a verification of this breakout. This has not yet been seen, so the situation remains mixed.
To make sure that you are notified once the new features are implemented, and get immediate access to my free thoughts on the market, including information not available publicly, we urge you to sign up for our free e-mail list. Gold & Silver Investors should definitely join us today and additionally get free, 7-day access to the Premium Sections on our website, including valuable tools and unique charts. It's free and you may unsubscribe at any time.
Thank you for reading. Have a great and profitable week!
P. Radomski
Editor
Sunshine Profits
Interested in increasing your profits in the PM sector? Want to know which stocks to buy? Would you like to improve your risk/reward ratio?
Sunshine Profits provides professional support for precious metals Investors and Traders.
Apart from weekly Premium Updates and quick Market Alerts, members of the Sunshine Profits’ Premium Service gain access to Charts, Tools and Key Principles sections. Click the following link to find out how many benefits this means to you. Naturally, you may browse the sample version and easily sing-up for a free trial to see if the Premium Service meets your expectations.
All essays, research and information found above represent analyses and opinions of Mr. Radomski and Sunshine Profits' associates only. As such, it may prove wrong and be a subject to change without notice. Opinions and analyses were based on data available to authors of respective essays at the time of writing. Although the information provided above is based on careful research and sources that are believed to be accurate, Mr. Radomski and his associates do not guarantee the accuracy or thoroughness of the data or information reported. The opinions published above belong to Mr. Radomski or respective associates and are neither an offer nor a recommendation to purchase or sell securities. Mr. Radomski is not a Registered Securities Advisor. Mr. Radomski does not recommend services, products, business or investment in any company mentioned in any of his essays or reports. Materials published above have been prepared for your private use and their sole purpose is to educate readers about various investments.
By reading Mr. Radomski's essays or reports you fully agree that he will not be held responsible or liable for any decisions you make regarding any information provided in these essays or reports. Investing, trading and speculation in any financial markets may involve high risk of loss. We strongly advise that you consult a certified investment advisor and we encourage you to do your own research before making any investment decision. Mr. Radomski, Sunshine Profits' employees and affiliates as well as members of their families may have a short or long position in any securities, including those mentioned in any of the reports or essays, and may make additional purchases and/or sales of those securities without notice.
Przemyslaw Radomski Archive |
© 2005-2022 http://www.MarketOracle.co.uk - The Market Oracle is a FREE Daily Financial Markets Analysis & Forecasting online publication.


