


GOLD Bullish on All Time Frames
Commodities / Gold and Silver 2011 Sep 05, 2011 - 03:02 AM GMTBy: Merv_Burak

 LONG TERM
From the long term perspective we are far from any real danger of a turn around to the bear side. Of course the long term technical indicators are by their nature slow to turn and much downside activity could take place before the indicators turn around. That’s what we have the intermediate and short term indicators for. As often mentioned, I try to keep things simple here. If you should find I’m getting too complicated please let me know. There are dozens of other commentaries on the internet where you can find the more complicated or sophisticated analysis. You don’t need another one.
Trend: Gold remains far above its long term positive sloping moving average line. It is far enough away from the moving average that one starts to worry that the gap between the two will start to tighten up. But that’s for another time.
Strength: The long term momentum indicator is once more moving higher inside its positive zone. It has just breached above its trigger line and the trigger has also just turned to the up side. Unfortunately, the momentum move seems to be somewhat muted and is not (yet) showing strength one wants to see on a bullish price move.
Volume: The volume indicator remains the strongest indicator of speculative interest. Unlike the price and momentum the volume indicator has been hitting new all time highs this past week. One should, however, be careful in interpreting the volume indicator. It is a cumulative indicator with the daily volume added on days of upside price closure and subtracted on days of negative price closure. A day like Aug 24th had a very high volume day on the down side but with the next two upside days the cumulative volume exceeded the volume of the 24th BUT the price of gold ended nowhere near where it was prior to the 24th. Volume is a weird indicator with a lot of nuances going into its interpretation. Take volume activity with a grain of salt unless you have looked at it very carefully. Ordinarily, I just us it for its overall trend, which right now is positive.
Putting all this together I can only rate the long term as BULLISH at the Friday close.
INTERMEDIATE TERM
As with the long term the intermediate term is still not in danger of a reversal to the bear.
Trend: Gold remains comfortably above its positive sloping intermediate term moving average line. It is far enough away from the moving average line that one would not worry about a breach any time soon, unless there was some very violent downside gold action.
Strength: Again, as with the long term the intermediate term momentum indicator continues to trend in its positive zone. It is moving higher but not with any real enthusiasm. It has broken above its trigger line and the trigger has just turned to the up side.
Volume: The volume indicator continues to move ever higher and remains above its intermediate term positive sloping trigger line. However, looking at the volume action another way we find that although this past week saw gold price in a basic upwards move the daily volume action has remained below its average intermediate term (50 day) volume. So, we have both a positive and a negative reading for the intermediate term volume action. Take your pick.
Putting all this together into my super sophisticated algorithm I find that the intermediate term rating remains BULLISH at the Friday close. This bull is confirmed by the short term moving average line remaining way above the intermediate term line.
SHORT TERM
Everything seems to be a-okay for the other time periods but what about the short term? Gold has been rallying for the past week and a half. So, what now?
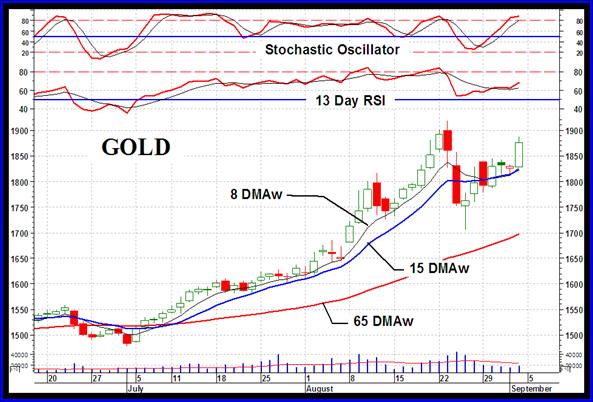
Trend: Gold is back above its short term moving average line (it was below the line a week ago) and the line continues in an upward track. It remains inside that boundary between the second and third FAN trend lines shown last week. I expect it will remain within the boundaries but eventually drop below the second FAN trend line.
Strength: The short term momentum indicator remains in its positive zone and above its positive trigger line. It too is not showing any great enthusiasm on the up side.
Volume: The daily volume action is still relatively low versus the past few months. It remains below its 15 day average volume line which does not suggest any great enthusiasm from speculators who REALLY move prices. It may be that the upward movement of the price is more because of lack of sellers rather than an over abundance of buyers. When you have no sellers it only takes a few buyers to move the price.
On the short term the rating is BULLISH as of the Friday close. This bull is confirmed by the very short term moving average line just breaching above the short term line.
As for the immediate direction of least resistance, I would think that is to the up side but it may not be for very long. The Stochastic Oscillator is already in its overbought zone and appears to be leveling off. The high of two weeks ago should also act as a resistance to much more upside in the price. So, direction is upward but limited.
SILVER
The silver P&F chart shown last week remains bullish with silver moving a couple of squares higher during the week. Although once more silver has ended the week with a slightly better performance than gold, it still was no great shakes from a trend standpoint.
LONG TERM
Trend: Silver remains comfortably above its positive long term moving average line.
Strength: Silver long term momentum remains in a very tight lateral box with only a 5% vertical depth. The upward drift of the past few weeks has not dislodged the momentum from this lateral path. It does, however, remain in its positive zone above its positive trigger line.
Volume: The volume indicator is also moving within a very tight box although the box here is slightly curved towards the up side. It remains above its positive long term trigger line.
On the long term the rating remains BULLISH, at the Friday close.
INTERMEDIATE TERM
Trend: Silver has touched the intermediate term moving average line a couple of times over the past few weeks but remains above the line. The line itself is still sloping upwards.
Strength: The intermediate term momentum indicator remains in its positive zone and has moved above a just turned positive trigger line. The momentum, however, is not showing any great strength at this time.
Volume: The volume indicator is just barely positive but remains above its positive trigger line, but not much above.
For now, at the Friday close, the intermediate term rating remains BULLISH. This is confirmed by the short term moving average line remaining well above the intermediate term line.
SHORT TERM
Trend: Friday’s close pushed silver nicely above an already positive sloping short term moving average line. The move is to the up side but there seems to be a serious resistance just ahead. We’ll have to wait and see if the resistance holds or if silver just breaks through it.
Strength: The short term momentum indicator remains just above its neutral line in the positive zone and just slightly above its positive sloping trigger line. From a short term perspective we have had a negative divergence two weeks ago which is still in effect.
Volume: As with gold the daily volume action is relatively low and especially this past week during the up price days. Not a good sign for trend longevity.
At the Friday close the short term rating remains BULLISH. This is just barely confirmed by the very short term moving average line, which is just a hair above the short term line.
PRECIOUS METAL STOCKS
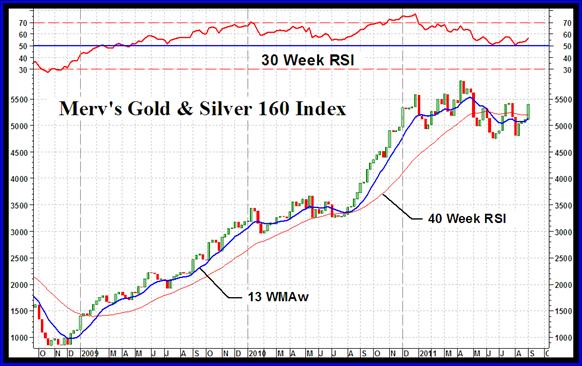
As often mentioned the Merv’s Gold & Silver 160 Index is based upon the average weekly performance of all 160 component stocks, each with an equal weight towards the Index value. Since the 2008 low point the average price of these 160 stocks has risen 538% to the Friday close (it was as high as 590% earlier). This is a considerable difference versus the performance of the major North American Indices. Both the NYSE Acra Gold BUGS Index and the NYSE Acra Gold Miners Index are making new highs this past week but are still only 266% and 260% above their 2008 lows, respectively. The PHLX Gold/Silver Sector Index is still some 9% below its May high but even in May it was only 223% above its 2008 low.
The 160 is not the best performing gold Index, the Merv’s Penny Arcade Index is up 1602% on the Friday close from its 2008 low. It had been as high as 2141% in early 2011 but has come down considerably. This is what has been causing me to be very cautious on gold stocks over the past few months. The penny stocks are usually the leading indicators of a gold market top. The leading time period is, however, not very well defined, only that the pennies do seem to top out ahead of the other gold stocks.
As the chart of the 160 Index shows, we had a very clear negative divergence in the long term momentum indicator (the 30 week RSI) at the Index peak in April. So far that warning is proving to be on the mark with the Index moving lower and the momentum showing even lower strength.
This will be the last brief commentary on gold and silver stocks. Future commentaries on the stocks and Indices as well as a weekly technical review of all Merv’s 190 stocks (160 in the universe plus 30 pennies) will be found in the subscriber’s section of the Precious Metals Central service at http://preciousmetalscentral.com.
I will continue to post the weekly Merv’s Precious Metals Indices Table.
Merv’s Precious Metals Indices Table
Well, that’s it for this week. Comments are always welcome and should be addressed to mervburak@gmail.com.
By Merv Burak, CMT
Hudson Aero/Systems Inc.
Technical Information Group
for Merv's Precious Metals Central
For DAILY Uranium stock commentary and WEEKLY Uranium market update check out my new Technically Uranium with Merv blog at http://techuranium.blogspot.com .
During the day Merv practices his engineering profession as a Consulting Aerospace Engineer. Once the sun goes down and night descends upon the earth Merv dons his other hat as a Chartered Market Technician ( CMT ) and tries to decipher what's going on in the securities markets. As an underground surveyor in the gold mines of Canada 's Northwest Territories in his youth, Merv has a soft spot for the gold industry and has developed several Gold Indices reflecting different aspects of the industry. As a basically lazy individual Merv's driving focus is to KEEP IT SIMPLE .
To find out more about Merv's various Gold Indices and component stocks, please visit http://preciousmetalscentral.com . There you will find samples of the Indices and their component stocks plus other publications of interest to gold investors.
Before you invest, Always check your market timing with a Qualified Professional Market Technician
Merv Burak Archive |
© 2005-2022 http://www.MarketOracle.co.uk - The Market Oracle is a FREE Daily Financial Markets Analysis & Forecasting online publication.