Is the U.S. Dollar King coming to take his Kingdom?
Currencies / US Dollar Sep 09, 2011 - 07:01 AM GMTBy: Capital3X
 September continues to rake it in even with all the news flows and volatility attached with it, we have been reasonably successful in keeping our portfolio immune to high volatility. That said, it has not impeded our ability to generate returns.
We believe that we have entered into a phase of a strong dollar against every currency including the CHF, YEN. It is almost as if king has come to retain his kingdom. But it may just last enough to wipe away a lot of short guys out before turning down on its fundamentals. Dollar is extremely sold against the CHF, YEN and the AUD. As and when the dollar turns back up, these are the currencies which will suffer the most. In fact CHF is already taking the lead in taking a beating. Read our analysis here which will not be found anywhere else (Not even the Big brokerages had a clue on CHF at least till yesterday while we were suggesting trades on CHF)
The 6 month dollar chart arguing for breakout rally
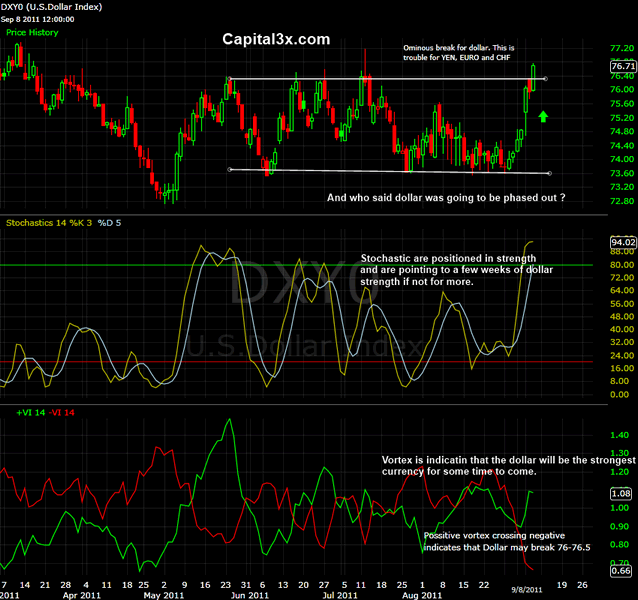
Dollar breaks through a tight range of 5 months. This is looking extremely similar to 2008 which after five months of tight range consolidation broke out in October 2008. We know what happened next. Will it happen this time? We do not know that and we advise our clients also not to speculate on such matters. You will always end up losing. The best way to play these is by analyzing price action on a daily, weekly and monthly basis. We at Capital3x maintain that all past and future movement of a stock/currency is embedded in today price. The question is whether one is competent enough to draw out the analysis.
This is the dollar chart from 7 September:
Full analysis. That is what we said then. We already a good 2% in dollar index from the time we put that.
Three different time frames analyzed on the dollar chart
Dollar Index daily:
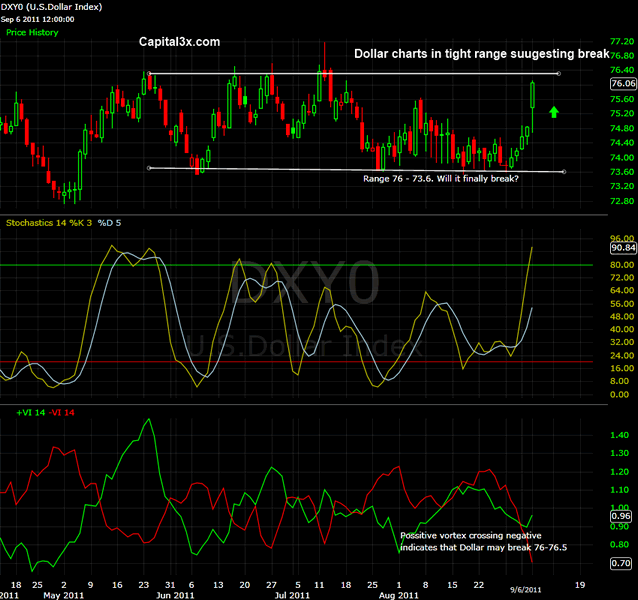
The dollar index is trying hard to rally. The daily chart shows the index jumping to 76 levels which is top range of 76.3 levels. Look for a pause and a break to affirm some kind of strength in the dollar as we approach Sept FED minutes.
The Stochastic are now pointing to extension of the trend. Vortex too is now arguing for a strength in the uptrend.
Dollar Index Monthly:
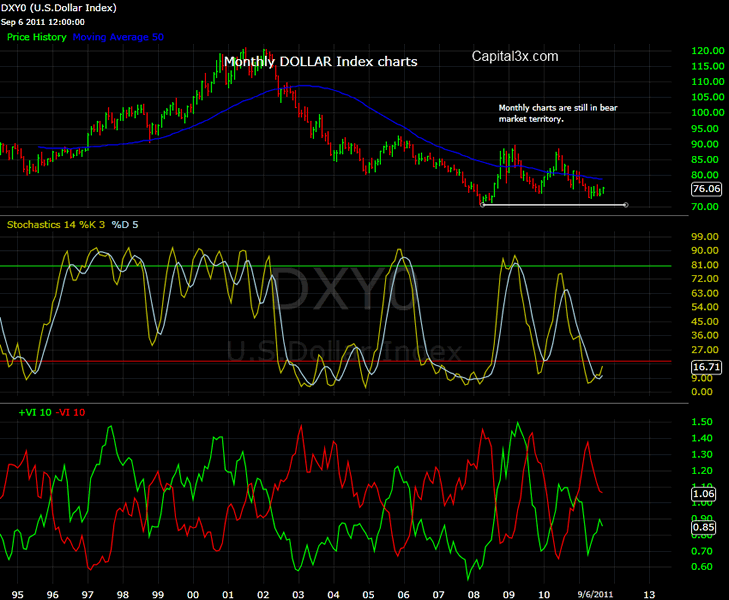
The monthly charts are yet to show us any kind of affirmation of the strength and there fore we suspect that any dollar strength may not be multi month phenomenon. But having said that charts can change over the course of the month.
Dollar Index UUP ETF:
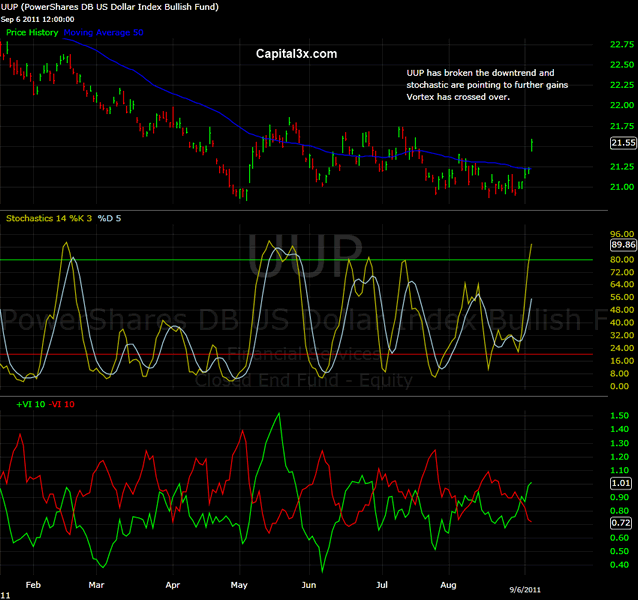
No major pickup in volumes as Volumes continue to fluctuate around the 50 dma (not shown in the charts). The Stochastic have picked and jumps to 91 levels pointing to strong gains on to 23-24 levels. Vortex is pointing to continued strength.
Another pattern which is important is 4 months of consolidation in Dollar index which is similar to the five months seen in 2008.
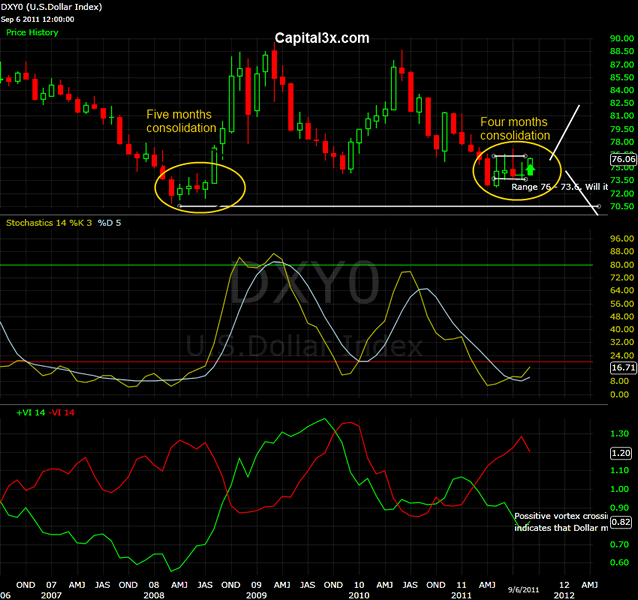
We do not believe in forecasting and speculating but we do believe in reporting what we see on our internal mathematical model which feeds off the technical indicators on price and volume all of which are pointing to renewed era of strong dollar.
S&P Daily charts
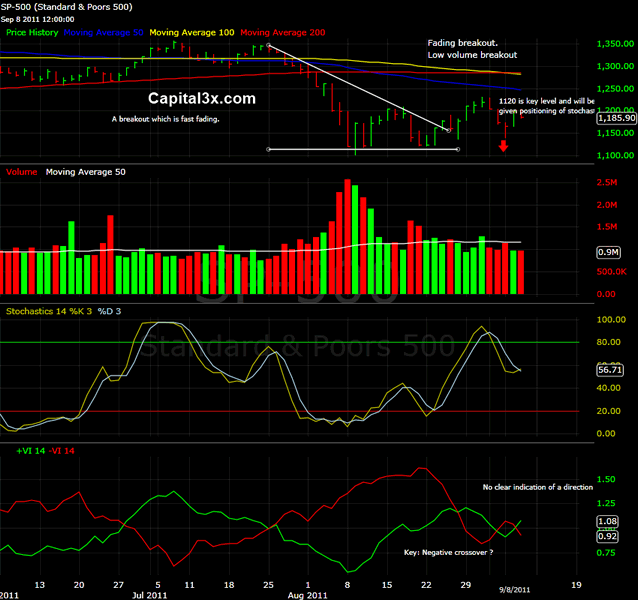
S&P500 continues to lack direction. We would have liked to say that S&P is headed 1120 and a break thereafter given dollar strong bias. But S&P indicators are not yet exactly disastrous. But given that markets can move 4-5% nowadays, do not expect the situation to remain exactly as reported here.
Our feeds: RSS feed
Our Twitter: Follow Us
Full analysis and trade portfolio can be obtained here
Kate
Capital3x.com
Kate, trading experience with PIMCO, now manage capital3x.com. Check performance before you subscribe.
© 2011 Copyright Capital3X - All Rights Reserved
Disclaimer: The above is a matter of opinion provided for general information purposes only and is not intended as investment advice. Information and analysis above are derived from sources and utilising methods believed to be reliable, but we cannot accept responsibility for any losses you may incur as a result of this analysis. Individuals should consult with their personal financial advisors.
© 2005-2022 http://www.MarketOracle.co.uk - The Market Oracle is a FREE Daily Financial Markets Analysis & Forecasting online publication.


