


Gold Deja Vu 1980?
Commodities / Gold and Silver 2011 Sep 14, 2011 - 01:48 AM GMTBy: Willem_Weytjens

 Have you ever experienced a "Deja Vu" feeling? Well, if you have never experienced one, maybe after reading this post you will.
Let's start with a technical chart of Gold. These days, gold is holding up strongly, and is only $80 below its all-time high.
If this continues, we might consolidate for a couple of weeks, to work off the overbought condition of the MACD indicator.
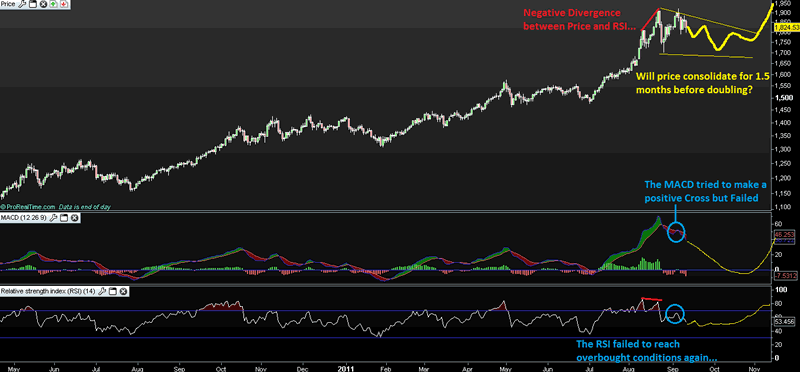
Chart: Prorealtime
Now have a look at the following Chart:
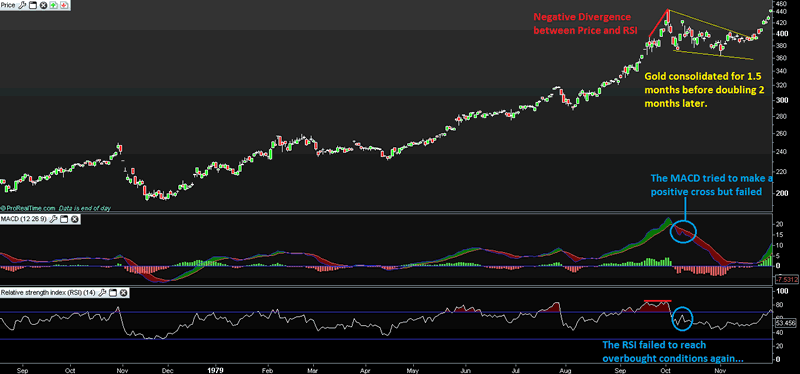
Chart: Prorealtime
The chart above is the gold price in 1970, right before it more than doubled 2 months later.
Don't they look very similar? To show you, I will now place one chart on top of the other one:
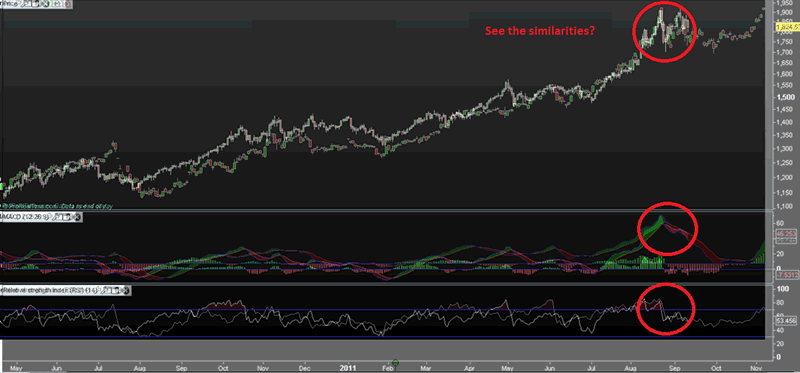
Chart: Prorealtime
Well, since Gold is acting very much like in the seventies, let's see what happened after... Based on this chart, Gold could consolidate until mid-late October, and then Double again in the weeks/months following.
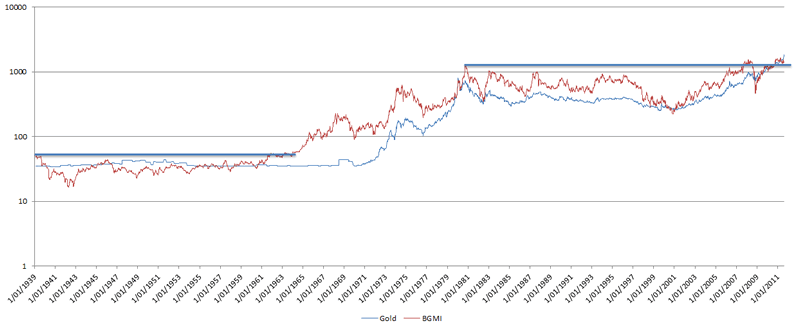
As of late, the shares of mining companies have been lagging the Gold price Big time!
However, as we can see in the chart below, the mining shares (represented by the Barron's Gold Mining Index) follow the gold price nicely over time. It looks like the Mining companies are breaking out of a multi-decade long consolidation pattern:
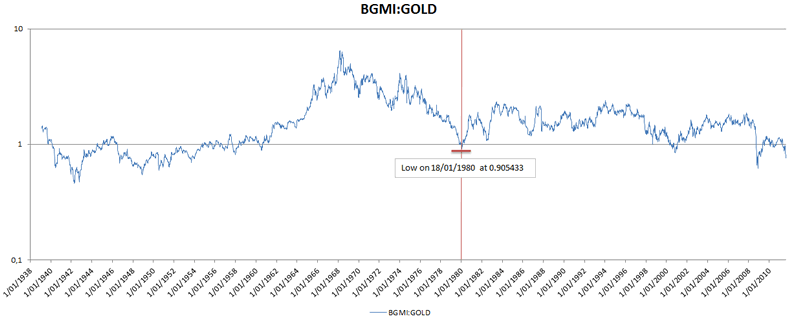
When we measure the BGMI (Barron's Gold Mining Index) in Gold, we can plot the outperformance or underperformance of Gold stocks compared to Physical Gold. A falling ratio means Gold stocks Underperform Gold, or equivalently, Gold outperforms Gold stocks.
Notice that the gold stocks were also underperforming gold before the top of 1980!
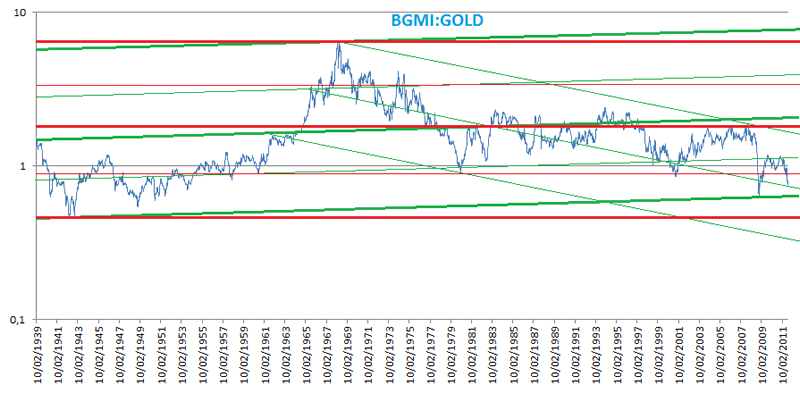
The following chart is the same chart as above, but now with some support and resistance lines.
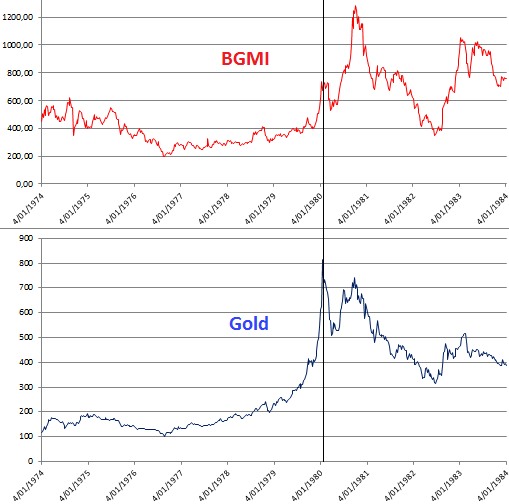
However, the most interesting observation is that as gold peaked in 1980, the Mining Stocks first retreated along with Gold, but then doubled in the months that followed, while gold did not make a new high until 2008!
What will happen to Silver if Gold doubles over the next couple of months?
If history is any guide, silver will also rally substantially.
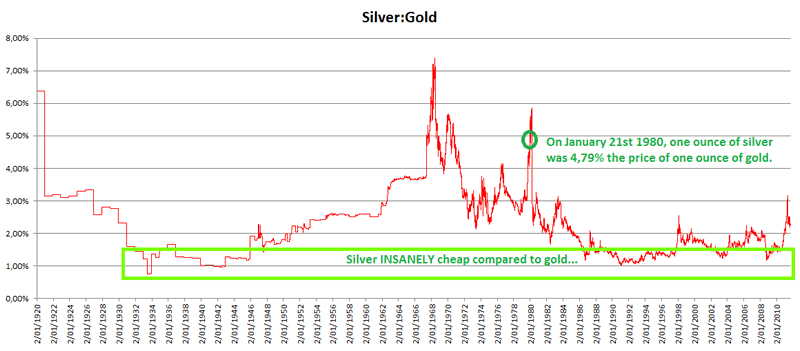
At the top of 1980, on January 21st, ONE ounce of Silver was 4.79% of the price of ONE ounce of Gold. Right now it is only 2.28% of the price of Gold. So if Gold is about to double from here, Silver should at least double as well, and if we would get back to the high of 1980 (Silver Price as a % of the Gold Price), Silver could potentially more than QUADRUPLE from here...
***** You can now try out our services during 5 days for only $5. That is only $1 per day! For more information, please visit the following Link: $5 Trial *****
For more analyses and trading updates, please visit www.profitimes.com
Willem Weytjens
www.profitimes.com
© 2011 Copyright Willem Weytjens - All Rights Reserved
Disclaimer: The above is a matter of opinion provided for general information purposes only and is not intended as investment advice. Information and analysis above are derived from sources and utilising methods believed to be reliable, but we cannot accept responsibility for any losses you may incur as a result of this analysis. Individuals should consult with their personal financial advisors.
© 2005-2022 http://www.MarketOracle.co.uk - The Market Oracle is a FREE Daily Financial Markets Analysis & Forecasting online publication.