


The Trading Doctor - Finding Your Trading Edge : Support & Resistance Levels
InvestorEducation / Trader Psychology Dec 12, 2007 - 01:48 AM GMTBy: Dr_Janice_Dorn

 “I'd be a bum on the street with a tin cup if the markets were always efficient…” Warren Buffett
Edges are what separate successful from unsuccessful traders. Those traders who find and exploit edges are the ones who end up winning. Moreover, the ability to execute on an edge is at the heart of behavioral trading.
In the introduction to this topic, the scene was set for you to begin to understand the concept of edge in behavioral terms.
It is critical to know that those who utilize behavioral trading believe that markets are neither random nor efficient. In other words, behavioral traders do not ascribe entirely to the Efficient Market Hypothesis or the Random Walk Theory. We look at something more akin to the Complex Adaptive Market Hypothesis put forth by Andrew Lo and colleagues.
Markets are not efficient because there are too many ill-conceived ideas and opinions floating around. Markets are not random because the strong emotions of traders create trends.
In order to find and profit from an edge in the markets, behavioral traders must search for and find what Michael Mauboussin has called “diversity breakdowns.” These are points of instability in price where there are likely to be collective overreactions or under-reactions caused by irrational traders and investors. The key to trading and investing successfully is to look for the points of greatest instability. In other words, in order to profit maximally, it is necessary to understand both your own psychology and the collective psychology of other market players.
Technical analysis, no matter what it is named (and there are more than enough methods and indicators to go around!), is nothing more than human emotions plotted on a grid. It is the task of the behavioral trader to find the places where emotions are running the highest, and exploit these for profit. Emotions of millions of traders in the markets result from brain-based (cognitive) biases. Cognitive biases provide the edge for behavioral traders. Simply put, trading edges are the result of cognitive biases and are found at areas where perception diverges from reality.
“Trust only movement. Life happens at the level of events, not of words. Trust movement…” A lfred Adler
With that background, let's move on to the behavioral basis of support and resistance. The concepts of support and resistance are quite simple - they are relatively easy to find with the naked eye or to plot on any chart. Support and resistance represent price points or regions around price points that appear to act as barriers, either on the downside (support) or the upside (resistance). A simplified illustration is shown in Figure 1.
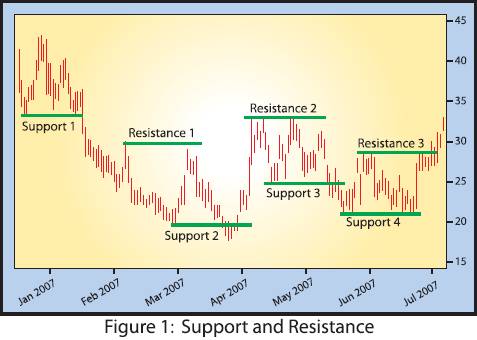
Support and resistance areas result from the collective behavior of market participants and are caused by three major thinking biases: anchoring, disposition and recency. When traders "anchor" on a price, they base their perceptions on information that is recent and readily available. A certain price (print) becomes an anchor. Subsequent prints are determined to be either too high or too low when compared with the recent anchor. Since these prices are quite simple to see on charts, they have great psychological appeal and are used widely.
For example, in Figure 1, the area labeled Support 1 at a low print of around 33 is an anchor, especially when the price rises to the 44 area. It is the Support 1 region which is an anchor for both short term and longer term traders. As the price begins to drop back toward the 33 area, that area becomes the anchor against which to judge if the price is too high or just about right.
Here is where the recency bias enters. Recency is the tendency for traders to emphasize and focus more on recent events, data and information. Thus, the print in the 33 area is weighted more heavily by traders than any previous prior lows.
Traders anchor on recent prices. That's the basis for the biases of anchoring and recency. It's just that simple.
Or is it?
Let's say that you wanted to buy on Figure 1 when the price reached the 33 area, but you didn't. Maybe you were looking somewhere else, or at some other indicator or different time frame and were expecting the price support to be lower than 33. You don't buy. It rises to the 43 area over the next few days. How are you feeling about that and what are you thinking? Chances are that you won't be a happy camper, and will feel a myriad of emotions, including anger, frustration and regret. Now, you see the price falling from the 43 area back toward the 33 area.
This time, you are looking to buy to make up for what you missed the last time it was at 33. In fact, even if it falls a little below 33, you may like it even more since it is cheaper and you are now anchoring on the 43 thinking that it is going to go back there. So you buy some at 33 and maybe some more a little bit lower. You are not alone in what you are thinking or seeing, as many thousands of other traders are also anchored on the print in the 33 area, and have just observed what happened the last time it went from 33-43. This is what causes buyers to come into the market at the area marked Support 1. Due to anchoring on a recent price, buyers come in, and the stock does what you thought it would do -- it bounces.
Support and resistance are psychological phenomena that result from large numbers of traders anchoring on recent data and looking at the same thing.
Support and resistance are not real phenomena, but rather are emotional responses and reactions to what the trader perceives. If most traders believe that the price will bounce when it hits 33, they create that support level and it becomes a self-fulfilling prophecy. Actions based on perception become reality, as many traders step in and buy because they believe that the price will increase from 33 to 43 just as it did the last time.
Moving smartly along with this, let's look at the third thinking bias which contributes to support and resistance -- the disposition bias. The disposition bias is rampant among traders, and refers to the tendency to take small profits rather than letting winning positions run higher. The brain bias for this is that fear of “giving back" profits increases as the stock runs higher and profits increase.
Here is an example of how the disposition bias works on support and resistance. Look on Figure 1 at the area marked Support 2. Let's say you bought in the 20 area sometime around the beginning of April. Look at the price movement off of the 20 area. It leaped up toward the 33 area quite rapidly. You did not sell because you were anchored on the recency of the previous high in the 43 area. Rather than going to the 43 area, the price hit around 33 and then fell back to the 24 area. How are you feeling, and what are you thinking now? Most traders will hold and hope, saying that it "has" to get back up to that 33 area again and I will sell then. The high of 33 now becomes a new anchor, replacing the previous anchor in the 44 area.
When the price goes back to the 33 area, you will and do sell. So does every other trader who is now anchored on 33. This is what creates Resistance 2 on Figure 1, i.e., a new anchor and many traders eager to sell at that point. The 33 area now becomes a new recent high anchor and is now considered a high price where many are prepared to sell. This selling creates a wall of resistance at that level.
These areas of support and resistance are points of chart instability created by the combined emotional instability of all others trading this particular item. They are not real; rather they are perceptual areas derived from cognitive biases which are most likely to become battlefields where prices will move higher or lower, depending on the predisposition and positioning of a large number of traders.
Resistance becomes a barrier from which higher prices are rejected. Support becomes a barrier from which lower prices are rejected. Support and resistance are pressure points where emotions run the highest and a high level of vibratory movement is likely to occur due to thousands or millions of people making trading decisions in and around that price area.
Trading by buying support and selling resistance is the edge for the so-called range or countertrend traders. These traders make money by buying in the area of support and selling in the area of resistance.
On the other hand, if one is employing a trend following (as opposed to countertrend or range-bound strategy), the edge is different. In the case of trend following, it is the breakdowns of support or resistance that provide an edge for the trader. An example of this is shown here in
Figure 2.
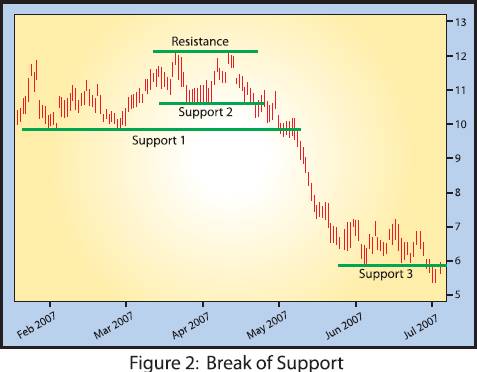
In Figure 2, Support 1 in the 10 area held the first time it was tested in mid-February. The price bounced from 10 and stopped at the 12 area where a new resistance was established. It then fell to the 10.5 area and bounced again but could not exceed the 12 area and began to fall back again toward the 10.5 area (which now has become Support 2). Countertrend traders were trading between Support 2 and Resistance between mid-March and mid-April. Shortly after that something happened at Support 2. The price hesitated at the Support 2 level (some countertrend traders were buying at the point, “expecting” to see a trade up to Resistance), but the price at Support 2 did not hold. It dropped into Support 1, hesitated and even moved up a bit (more weak buying pressure).
Then, in early May, the price began dropping through Support 1 and continued to drop from May to early June (from the 10.5 area to the 6 area at Support 3), where it found some support for a while, and then continued to drop more. That meant that anyone who had bought at either Support 1 or Support 2 who did not have a stop and get out, was sitting on a large loss. This is particularly true of those who anchored on Support 2 and bought more at Support 1, since it was also a recent anchor.
Seasoned countertrend traders would have been out of the trade on or near the close at the beginning of May. They saw that the area of price instability at Support 1 was not holding. These smarter countertrend traders know that support and resistance are not set in stone. Sometimes they hold and sometimes they don't. They have trained their brain to see this type of hesitation around a Support or Resistance anchor, know when the anchor is not going to hold and get out. The rest of the traders who do not have this type of brain synaptic strategy do not get out and watch in helplessness and despair as the stock tumbles downward.
This is what happens over and over again to novice traders with no planned and programmed synaptic strategies. They either can't or won't get out. They don't know what to do when they are on the wrong side of the markets and the markets move violently and quickly against them.
This type of movement is the bread and butter of trend traders who buy new highs and sell new lows. As the countertrend traders are panicking out of their long positions all the way down from Support 1 to Support 3, the trend traders are continuing to short into the weakness.
Thus, in contrast to range (countertrend) traders whose edge is trading by buying support and selling resistance, the edge for trend traders is quite different.
Trend traders profit at those points of market instability where support and resistance break down. At these times, there is a distortion of perception and cognitive biases because most are still anchoring on recent orderly price movements. Traders get lulled into thinking that the markets are rational and that they can keep doing the same thing over and over again and make profits. This works until it doesn't. It is at those points where reality trumps perception and the countertrend trader is unable to adjust his or her biases quickly enough to take action and get out. This is the “What the heck is happening here? Why is it not holding? Maybe it's just temporary. The market has it all wrong and it is going to come back soon. Why didn't I get out? I can't get out now because I would have to take too much of a loss. I can't take it any more and have to close my eyes and sell now!” situation.
The takeaway from this is that price points or areas of support and resistance are points of volatility and instability. They can be great edges or they can throw you right off the edge and into the abyss. Support and resistance areas are excellent illustrations of the battleground of psychological warfare in the markets.
Seasoned traders see this time and time again. They have trained their brains to be extremely cautious and hyper-vigilant in these areas. It is at these times that fortunes in the markets are made or lost. It is at these areas of price instability which are called support and resistance that the true market battles occur. One side is going to win and the seasoned trader is flexible enough to be on the winning side. How does the seasoned trader win? By either getting out when the anchor does not hold or getting in and riding it up or down until the trend ends and bends.
It is not the strongest of the species that survives, nor the most intelligent, but the ones most responsive to change … Charles Darwin
Good Trading and Brain On!
By Dr. Janice Dorn, MD, PhD
Prescriptions for Profits
www.thetradingdoctor.com
Signup for your risk-free subscription to the Trading Doctor Newsletter. If you are not completely satisfied that our newsletter is for you just let us know, via email, within 7 days of your subscription date and we'll immediatly refund your money.
© Copyright 2006-07 -- Janice Dorn, M.D., Ph.D. -- Ocean Ivory LLC
Dr. Janice Dorn is a graduate of the Albert Einstein College of Medicine, where she received her Ph.D. in Neuroanatomy. She did her postdoctoral work in Neurophysiology at the New York Medical College. She received her M.D. from La Universidad Autonoma de Ciudad Juarez, did one year of clinical clerkships in Phoenix, Arizona. and then completed a Neurology Internship at The University of New Mexico in Albuquerque. For the past twelve years, Dr. Dorn has focused her attention on trading, mentoring and commentary in the financial markets, with emphasis on Behavioral NeuroFinance, Mass NeuroPsychology, Trading NeuroPsychology, Futurism and Life Extension. A graduate of Coach University, she is a full time futures trader and trading coach. Dr. Dorn is the author of over 300 publications, relating to Trading and Investing Neurouropsychology, Market Mass Neuropsychology, Behavioral Neurofinance, and Holistic Wellness and Longevity.
Dr. Janice Dorn Archive |
© 2005-2022 http://www.MarketOracle.co.uk - The Market Oracle is a FREE Daily Financial Markets Analysis & Forecasting online publication.