Crude Oil Demand to Continue Accelerating for Decades - Energy Sector Trends Analysis
Commodities / Crude Oil Dec 15, 2007 - 03:13 PM GMTBy: Joseph_Dancy

 While we did not see $100 a barrel crude oil in the futures market last month we remain bullish on the energy sector. One of the more interesting charts we happened across last month was from the Oil Drum. It plots global crude oil and natural gas liquid production versus time. (See chart at right)
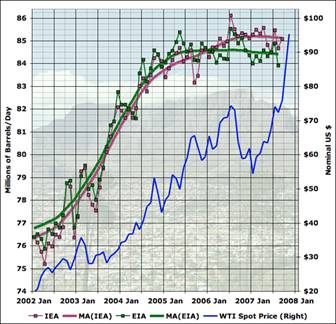 Texas oilman and hedge fund manager T. Boone Pickens for well over a year now has questioned whether global production of crude oil liquids can exceed 86 million barrels per day. Many analysts disputed his analysis, claiming production could be increased well above the 86 million barrel per day level as new supplies were brought online and older fields were upgraded.
While not making a judgment whether Mr. Pickens is correct or not, the chart at right is quite interesting in light of his comments. Keep in mind global demand for crude oil has been increasing about 1.5 million barrels per day per year with global demand for petroleum liquids correlating very closely with economic growth.
Many countries have experienced robust economic growth and are placing their increasing demands for energy on the global marketplace. Developing countries generally have very energy inefficient economies that require much more energy input per unit of growth than in North America . Should demand for crude oil liquids approach or exceed available supplies prices could skyrocket. The global market players most likely would in that situation move toward a hoarding mentality and resource nationalization would become a larger issue for consumers.
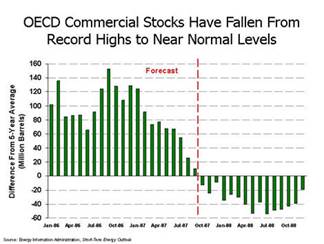
Another interesting chart we ran across last month plotted the oil inventory levels of Organization for Economic Cooperation and Development member nations over the last year and a half and the projected levels going forward.
OECD is comprised of thirty member democratic countries that produce two thirds of the world's goods and services. Its member countries are primarily located in Western and Eastern Europe , but also include the United States , Canada and Mexico .
The forecast, provided by the Energy Information Administration, indicates that while oil stocks have been well above the 5 year average over the last few years those excess stocks are falling rapidly. In the near future OECD stocks are projected to be below the five year average while OECD demand continues to increase.
Excess inventories are helpful in addressing temporary supply interruptions and keeping the associated price fluctuations to a minimum. On a days of forward demand basis OECD inventories are down 5% from year earlier levels and are expected to fall further - which should keep short term oil prices firm.
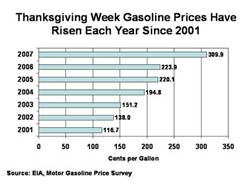
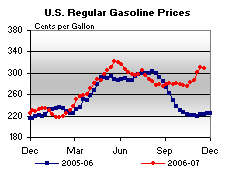
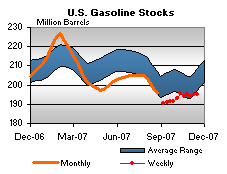
 Meanwhile, in the United States gasoline inventories have fallen below their long term average. This trend has been reflected in strengthening gasoline prices over the last several months. The long term trend in gasoline prices remains upward.
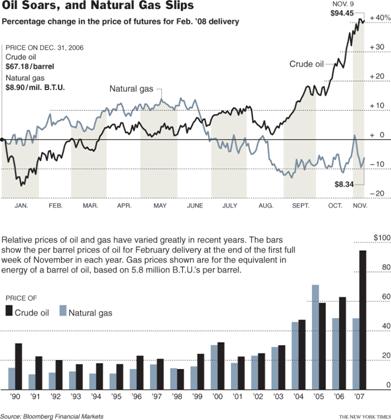
One of the more interesting articles and charts we can cross last month was in a New York Times article on the comparative value of crude oil and natural gas. (See chart at right)
Due to the fact that domestic natural gas inventories have been at or near five year highs for much of the last year natural gas prices have not risen as much as crude oil prices.
The impact of soft natural gas prices on North American drilling and completion activities has been quite evident – and is one reason the drilling day rates have been well below levels many small drilling companies and equipment providers expected.
Even with the large amount of natural gas in North American storage, and even though many long term forecasts project that winter temperatures will be well above normal cutting into demand, we think that over the next 12-18 months natural gas prices will advance from current levels.
On a heating content basis natural gas is now selling at roughly one-half the value of crude oil.
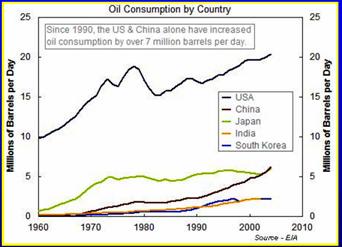 Last, a slide from investment banker Matthew Simmons is worth reviewing. While the U.S. economy is much more energy efficient than it was 40 years ago demand for crude oil continues to increase. (See chart at left)
The demand for oil in countries such as China is rocketing upward, a function of the incredible economic growth of that country and also a function of the fact that the Chinese economy is not as energy efficient as those in North America or Europe .
Going forward, with the increasing auto sales and urbanization of that country demand for oil should continue to accelerate – which will place additional strains on the global supply network for decades to come.
By Joseph Dancy,
Adjunct Professor: Oil & Gas Law, SMU School of Law
Advisor, LSGI Market Letter
Email: jdancy@REMOVEsmu.edu
Copyright © 2007 Joseph Dancy - All Rights Reserved
Joseph R. Dancy, is manager of the LSGI Technology Venture Fund LP, a private mutual fund for SEC accredited investors formed to focus on the most inefficient part of the equity market. The goal of the LSGI Fund is to utilize applied financial theory to substantially outperform all the major market indexes over time.
He is a Trustee on the Michigan Tech Foundation, and is on the Finance Committee which oversees the management of that institutions endowment funds. He is also employed as an Adjunct Professor of Law by Southern Methodist University School of Law in Dallas, Texas, teaching Oil & Gas Law, Oil & Gas Environmental Law, and Environmental Law, and coaches ice hockey in the Junior Dallas Stars organization.
He has a B.S. in Metallurgical Engineering from Michigan Technological University, a MBA from the University of Michigan, and a J.D. from Oklahoma City University School of Law. Oklahoma City University named him and his wife as Distinguished Alumni.
Joseph Dancy Archive |
© 2005-2022 http://www.MarketOracle.co.uk - The Market Oracle is a FREE Daily Financial Markets Analysis & Forecasting online publication.


