


Stock Markets Consolidating Towards a Cycle Bottom by Christmas
Stock-Markets / Cycles Analysis Dec 17, 2007 - 09:48 AM GMTBy: Andre_Gratian

 Current Position of the Market
SPX: Long-term trend - The 12-yr cycle is nearing its mid-point and some of its dominant components may already be restraining the bullish effect of the 4.5-yr cycle. 2008 should see a period of correction into the late summer or Fall, followed by an eventual bull market top in 2009-10.
SPX: Intermediate trend - an extended intermediate-term consolidation is in process.
Analysis of the short-term trend is done on a daily basis with the help of hourly charts. It is an important adjunct to the analysis of daily and weekly charts which determines the course of longer market trends.
Overview
After completing a move from 1406 to 1523, the SPX is now retracing a good portion of its uptrend, closing last week at 1467.95. The large swing reversals since July have managed to confuse both bulls and bears as the market cannot seem to make up its mind in which direction to go.
The bulls see the SPX in an extended corrective pattern which started in early July and which is very close to concluding. The bears feast on the plethora of bad news which keep appearing in the financial media and see the market's inability to extend its uptrends as a bearish sign. Who will be right?
We should soon know, because the most propitious time for the market to conclude its corrective pattern -- if this is what it is doing -- will be about Christmas. After that, the market must prove itself by beginning a strong rally which will carry it to new highs. If it does not, it will probably mean that it needs an even longer correction into next year along with lower levels.
According to the faithful Decennial pattern which has a record of over 100 years, the 7th year (which we are just ending) is the ideal year during which a bull market makes a correction before it goes on to expire in the 9th or 10th year. It is true that the low occasionally comes in the 6th or 8th year, and perhaps it will be the case again this year, but since the cycles and pattern appear to favor 2007 this time, let's give it at least a chance to prove itself.
What's ahead?
Momentum:
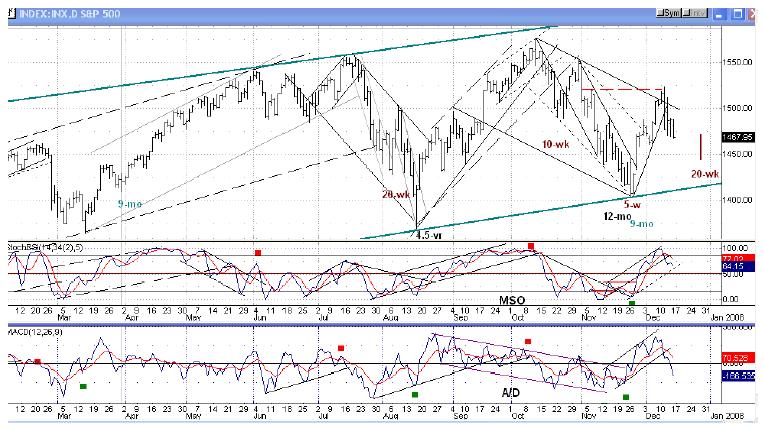
On the following chart of the daily SPX, you can see that there was a lot of positive divergence appearing on the oscillators at the bottom of the chart when the index made its low. No such protracted divergence exists at the recent top, as compared to the extended period of divergence that occurred at the last top in October, so there was no warning for the reversal of the past week in the daily indicators, except that they were overbought. The warning was more obvious in the hourly A/D and there was a combined Point and Figure and Fibonacci target to 1523 which was hit precisely before the reversal.
Weakness is still showing in the oscillators, especially in the A/D at the bottom, and that means that we have not yet reached the low of the correction. It will probably be determined by the 20-wk cycle which is due to make its low around Christmas time. There is also a fairly clear Fibonacci target zone which will be discussed later.
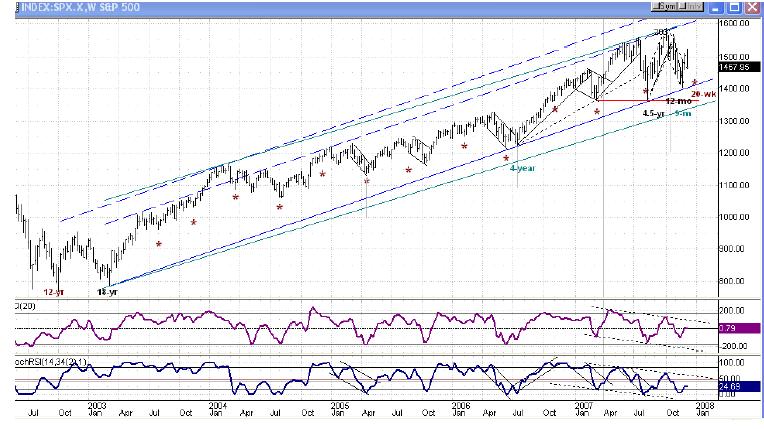
On the weekly chart of the SPX which follows, you can see that within the context of the longterm trend which started in 2002-2003 as a result of the 12-yr and 18-yr cycles bottoming about 6 months apart, the current pattern could very well be just a needed consolidation of an overbought market. It was easy to assume that after the 4.5-yr cycle made its low in August the uptrend would resume, especially after it was reinforced by the bottoming of the 9-mo and 12-mo cycles in November, but the rash of negative fundamentals about the sub-prime problem which bombarded the news prevented the uptrend from extending itself right away. Cycles and economic fundamentals both exert an influence on the stock market , and if it had not been for the 4.5-yr bottoming when it did and providing some upward pressure, we could have seen a very steep decline.
One thing to note on this chart is that the bottom indicators never did confirm the resumption of the uptrend and are still trending down. If they fail to develop some upward momentum and break-out of their down channels as the index rallies at year-end, the odds favor that the correction will continue ... perhaps all the way to March-April which is the next low of the Hurst 18-mo cycle.
Cycles
The cycles that have affected the market are clearly marked on the above charts. The asterisks on the weekly chart represent the lows of the 20-wk cycle going back to the beginning of the bull market. This is the cycle which is currently controlling prices and which will be responsible for bringing about a reversal to the upside after it has made its low. The best time estimate for this is just before or just after Christmas, but it does not always bottom exactly every 20 weeks. In March, for instance, it turned out to be only 19 weeks long.
I am also expecting a 6-wk cycle low just about the same time, so the two combined could create a mini-climax into the projection area.
Projections:
There are two Fibonacci projections for the current decline: The short-term one is to about 1460. If that level is broken, it is conceivable that prices could move back down to about 1440 or slightly lower.
The current Point & Figure chart pattern does not lend itself to any clear projection.
Breadth
Longer-term breadth, as reflected in the McClellan summation index has not been good for some time and has basically been in a down-trend since March or April. With the low of the 4.5-yr cycle, it attempted to get back in an uptrend and had a rood rally, but lost all that momentum in the subsequent decline and was not able to regain it in the rally from 1407 to 1523. This could become a concern for the weeks ahead if it does not stabilize soon and resume its uptrend. Breadth must support price.
The MACD of the A/D which I use as a short-term breadth indicator and which is pictured on the daily chart above, gave a clear forewarning that a good rally was coming at 1407, but it is not giving such an indication right now and is making a weaker pattern than the momentum oscillator.
Market Leaders and Sentiment
Things are a little mixed, here. GE which reported disappointing earnings sold off while the market was rallying and has remained at the bottom of its long-term channel.
The NDX is still stronger than the SPX on an intermediate-term basis, but has been roughly in synch with it in the past few weeks.
The short-term pattern of the ISEE put/call ratio is neutral, insider buying continues to be predominantly bullish.
Summary
The stock market has undergone an extended consolidation since July. The preferred corrective pattern suggests that it is in the final stages of completion which will probably coincide with the bottoming of the 20-wk cycle about Christmas time.
The market will then have a chance to prove that the correction is really over or if it will need to continue into 2008.
The following are examples of unsolicited subscriber comments:
What is most impressive about your service is that you provide constant communication with your subscribers. I would highly recommend your service to traders. D.A.
Andre, You did it again! Like reading the book before watching the movie! B.F.
I would like to thank you so much for all your updates / newsletters. as i am mostly a short-term trader, your work has been so helpful to me as i know exactly when to get in and out of positions. i am so glad i decided to subscribe to turning points. that was one of the best things i did ! please rest assured i shall continue being with turning points for a long while to come. thanks once again ! D.P.
But don't take their word for it! Find out for yourself with a FREE 4-week trial. Send an email to ajg@cybertrails.com .
By Andre Gratian
MarketTurningPoints.com
A market advisory service should be evaluated on the basis of its forecasting accuracy and cost. At $25.00 per month, this service is probably the best all-around value. Two areas of analysis that are unmatched anywhere else -- cycles (from 2.5-wk to 18-years and longer) and accurate, coordinated Point & Figure and Fibonacci projections -- are combined with other methodologies to bring you weekly reports and frequent daily updates.
“By the Law of Periodical Repetition, everything which has happened once must happen again, and again, and again -- and not capriciously, but at regular periods, and each thing in its own period, not another’s, and each obeying its own law … The same Nature which delights in periodical repetition in the sky is the Nature which orders the affairs of the earth. Let us not underrate the value of that hint.” -- Mark Twain
You may also want to visit the Market Turning Points website to familiarize yourself with my philosophy and strategy.www.marketurningpoints.com
Disclaimer - The above comments about the financial markets are based purely on what I consider to be sound technical analysis principles uncompromised by fundamental considerations. They represent my own opinion and are not meant to be construed as trading or investment advice, but are offered as an analytical point of view which might be of interest to those who follow stock market cycles and technical analysis.
Andre Gratian Archive |
© 2005-2022 http://www.MarketOracle.co.uk - The Market Oracle is a FREE Daily Financial Markets Analysis & Forecasting online publication.