


Confusion in The Markets - What Could it Mean?
Stock-Markets / Financial Markets Dec 17, 2007 - 10:07 AM GMTBy: Brian_Bloom

 From close up, there is no making sense of what is happening in the markets today. Certainly, in all the years of my involvement in and around the markets I have never seen such confusion at the coalface.
One reason, I suspect, is that there are broadly based vested interests at work which are battling for all they are worth to ensure that the infrastructure doesn't unravel.
But I have just finished reading an article which my stockbroker sent me today, and the following sentence caught my eye:
“A strong recovery in the US share market through 2008 should lead to a reasonable year for the Australian stock market, though metals prices may give a flat to subdued background.”
The apparent rationale for the author having made that statement was twofold:
- He analyses 10 year cycles, and we are apparently not yet at the point in the cycle where it is due to turn down
- In the last 80 years, of the ten years ending in 8, only 2 have been down. All the rest except for one have been at least 10% up”
So, without commenting on the whys wherefores and probabilities of this forecast, the fact is that there are people out there – many of whom have a vested interest to see the markets keep rising - who are genuinely anticipating the markets to rise. Clearly, markets are made by the existence of opposing views.
When we look at the daily charts – in particular the one below of the Dow Jones Industrial Index (courtesy Bigcharts.com ) the battle between bulls and bears hits the analyst between the eyes
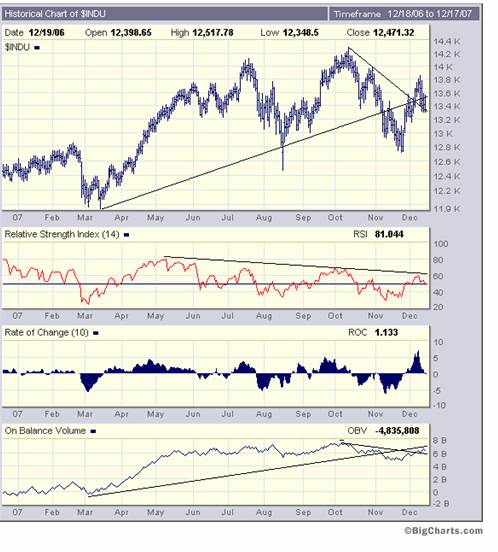
First, let's look at the trendlines on the price chart above. The rising trendline was (falsely) broken on the downside during early November, and the falling trendline was (falsely) broken on the upside about 7 days ago.
Where we are now is that the rising trendline is (paradoxically) offering resistance to further upside and the falling trendline is (paradoxically) is offering support. This is most unusual.
Now, if we look at the On Balance Volume Chart and we remember that volume precedes price, we see that the OBV gave a sell signal when it fell below its rising trendline (which is now offering resistance to further upside) and it gave a buy signal when it broke above its falling trendline (which is now offering support). The only difference between the price chart and the OBV chart is that the OBV sell signal cannot be said to have been “false” because it did not rise back up above the rising trendline. On the other hand, the buy signal can also not be called a false buy. This chart is also sitting in no man's land.
The two oscillator charts, however are both giving ultra short term sell signals as they peak through the fulcrum lines on the downside, and the rate of change chart is showing a trend of falling tops. On balance, the oscillators are bearish and, if they keep going down, both the Price Chart and the OBV chart may fall below their falling trendlines.
On this particular daily chart, the balance of probabilities favour a resumption of the bear trend which is currently characterised by a top in mid October followed by two subsequent tops at lower levels.
Now, if we look at the daily chart of the gold price (courtesy yahoo.com ), we see that the 50 day Moving Average has also been penetrated on the downside, but in the context of its historical behaviour that downside penetration doesn't look particularly disturbing. The price could pull back to around $750, and even $700, without any cause for concern.
Now let's take a step back and look at some weekly charts:
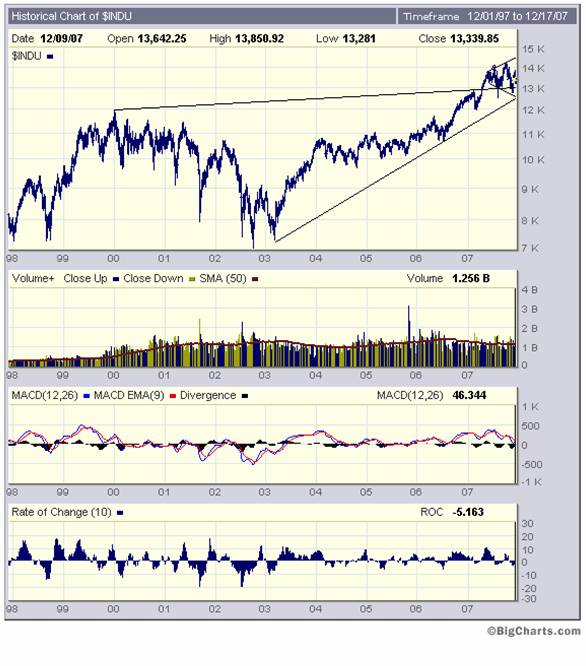
The weekly chart of the DJIA above is showing similar signs of indecision. There is a megaphone formation which shows rising highs and falling lows. This makes no sense at all because it implies that the bulls are becoming increasingly optimistic even as the bears are becoming increasingly pessimistic.
The 13,000 level on this chart looks to be very important. The upper rising trendline has twice before been temporarily penetrated on the downside and currently offers support at 13,000. The lower rising trendline is showing support at around 12,500.
Frankly, no conclusions can be drawn from this chart other than the market is becoming increasingly confused.
My guess as to what is happening is that the serious investors are bailing out and the vested interests are working harder and with increasing frenzy to prevent a collapse.
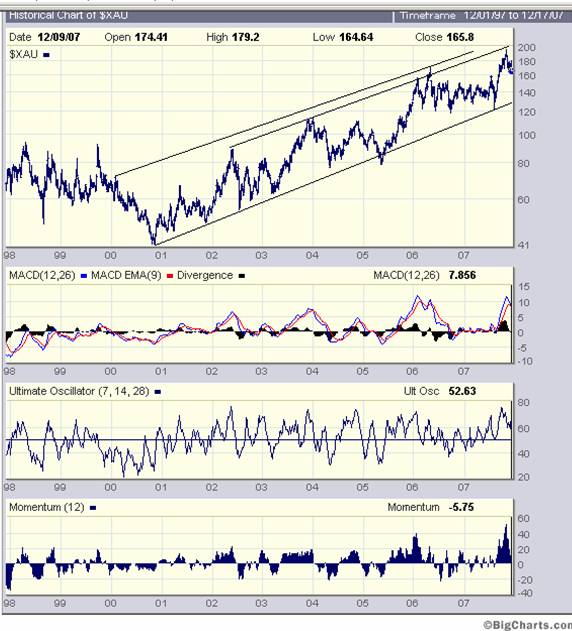
By contrast to the above chart, the weekly $XAU chart below looks like it may have some significant short term downside in context of its rising trend – given that the oscillators are not looking happy and the price itself is near the top of its channel
Conclusion
Given the electioneering going on in the background, and given the massive support being given to the markets by the Fed, vested interests seem to be holding at bay the market's natural inclination to want to fall.
This is a very tricky situation because it has the makings of a panic if something unforseen should occur.
The usual candidates for accidents would be the oil price and the Dollar
The oil price chart below (courtesy stockcharts.com ) looks overbought, but I don't trust it.
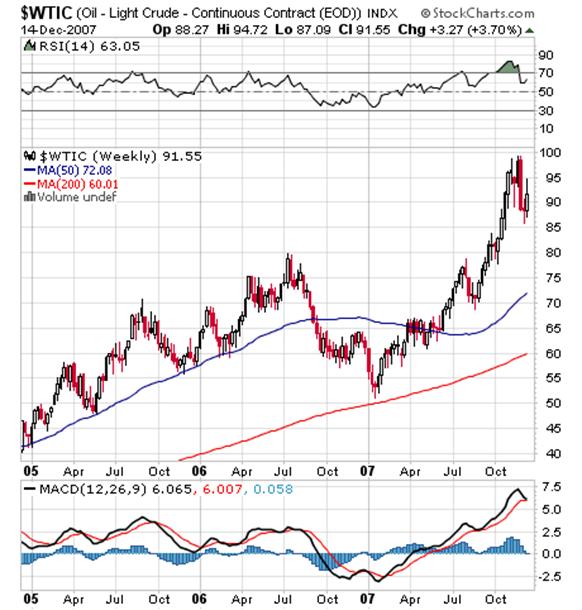
The reason I don't trust it is that I have been monitoring the number of US homes that have been suffering power blackouts during the winter season since December 1 st 2007 and, so far, we are up to around 1.25 million as compared with 4 million for the whole of the 2006/7 Winter. Further, the chart below is very revealing. It shows that some Global Warming Models have seriously overestimated temperature rises relative to actual.
The green lines are forecast and the yellow lines are actual. Temperatures were taken over the tropics.
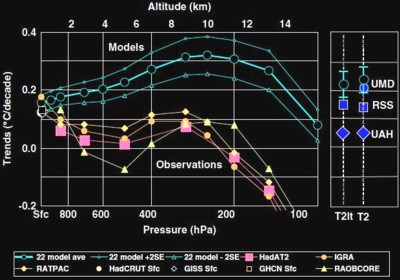
Source: http://motls.blogspot.com/2007 /12/douglass-christy-pearson -singer.html
Original source was the main article from which the following is an abstract: http://www3.interscience.wiley .com/cgi-bin/abstract/117857349 /ABSTRACT?CRETRY=1&SRETRY=0
The oil price could represent fertile ground for a shock which, by definition, comes unexpectedly and the above chart is not expecting a strong up-move despite the savage cold. If anything the above chart is calling for a pullback in the oil price (as expressed in US Dollars).
The chart below of the US Dollar may hold some surprises – in that it has quite a lot of upside potential in the event a change of sentiment begins to manifest. Note how the oscillator is giving a tentative buy signal
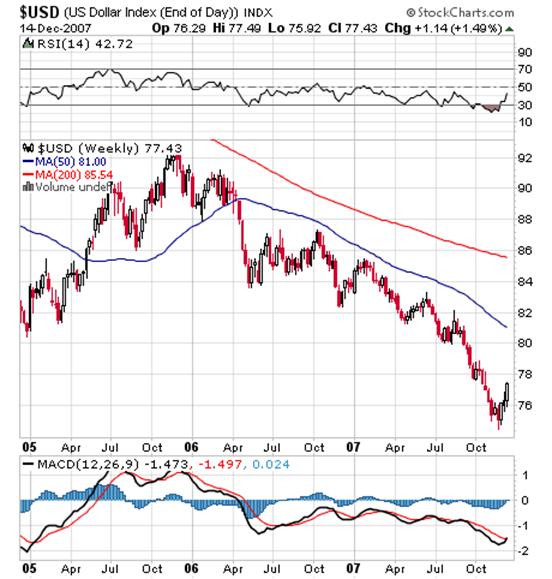
What does this mean? Why would the dollar rise?
Aha! Here's a possible surprise. Note how the chart below of the ten year yield looks like its pushing to the upside
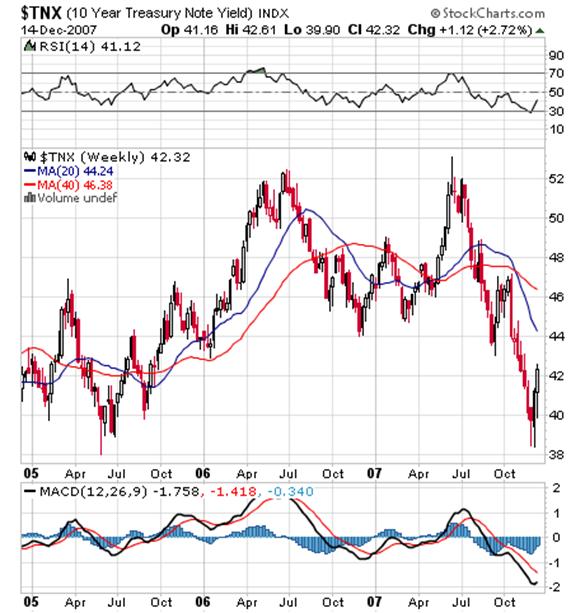
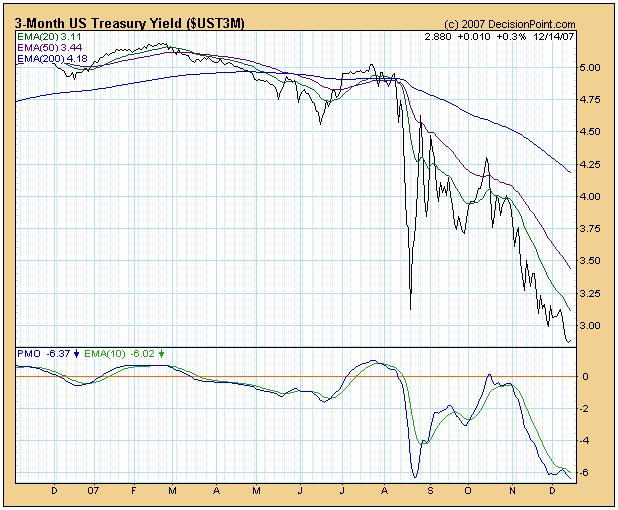
At the short end of the market, the 3 month Treasury Yield (courtesy decisionpoint.com ) seems to be deeply oversold – with more upside than downside.
Overall Conclusion
The bouncing dollar seems to be confirming that the market is expecting yields to tighten in the foreseeable future. This would not be good for the gold price in the short term and, depending on your perspective, you could argue either way for the equity markets. The bulls might argue that a rising dollar might indicate money coming into the country which might find its way into equities; and also that money might be switched from bonds into equities. But the bears may argue that rising interest rates are bad for business.
The industrial equity charts, on the other hand are indecisive – so much so that there could be an emotional overreaction to any surprise.
This is not a situation where anyone can make a call based on objective analysis. Objectively, the underlying fabric of the economy is fraying even as the authorities are scrambling to keep the fabric from tearing.
By Brian Bloom
Author's note : Personally, I am monitoring on a daily basis, and like a hawk, the pattern of the USA's winter weather and the associated electricity blackouts. The models I am following tell me that we might see some unexpected developments in the context of so-called Greenhouse Gas-Global Warming linkages.
On another level, I am getting closer to finalising the third draft of Beyond Neanderthal's manuscript, preparatory to sending it for final editing. The pieces of the jigsaw puzzle of the underlying research are falling into place in a way that is taking my breath away. Everything – literally everything – is cross correlating. Paradoxically, the “fit” is so elegant that it looks like we might be on the threshold of an important evolutionary breakthrough – but the forward movement will not be without some significant pain during the transition phase.
If you have an interest to acquire a copy when it is published – targeted for end March 2008 - please register your interest on my website at www.beyondneanderthal.com
Copyright © 2007 Brian Bloom - All Rights Reserved
Brian Bloom Archive |
© 2005-2022 http://www.MarketOracle.co.uk - The Market Oracle is a FREE Daily Financial Markets Analysis & Forecasting online publication.