Gold and Silver Building Bullish Momentum
Commodities / Gold and Silver 2011 Oct 31, 2011 - 03:21 AM GMTBy: Bob_Kirtley
 After correcting from above $1900 to below $1550, gold prices have undergone the necessary consolidation and now look poised to challenge the old highs.
Examining the chart below it is apparent that the recent decline in gold prices was not the bursting of a bubble, but merely a correction within a larger secular bull market. Although we were not fortunate enough to take a short position prior to the correction, we did signal a bullish options trade on GLD to subscribers on 26 September 2011, the day gold prices bottomed.
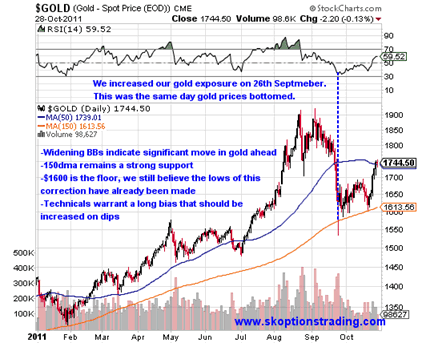
We felt that the longer term bullish fundamentals for gold remained intact and on the technical side we have long considered that a Relative Strength Index (RSI) of 30 or below signifies that gold prices are oversold. This signal has worked well for us for a number of years. Therefore when the RSI dipped to 30 (and in fact it went below 30 on an intra-day basis) we issued a trading recommendation to SK OptionTrader subscribers. That options trade is currently showing a 32% profit in 32 days.
We also consider the 150 day moving average a key support level and although gold prices dipped below the 150dma on an intra-day basis, they did not settle below there. In our opinion the sharp intra-day reversal on September 26th showed the strength behind gold’s longer term bullish fundamentals. Remember that the gold market is a two tier market, one for futures and other derivatives, and one for the physical metal. Although futures may have dipped below $1600, we understand that it was near impossible to find sellers of physical gold that day at those prices. There are big buyers of the physical metal on dips and that buying power has put the floor in gold at $1600.
Looking forward we think that there is a strong chance that gold will challenge its all time highs by the end of the year. It has only taken a week or so for gold to rally from $1600 to $1740, an 8.75% increase in price. Another rally of that size from current prices puts gold at $1892. There is certainly enough time for this to be achieved in 2011.
Another positive sign we are seeing in the gold market comes from the trading action in gold options over the last week, where we have observed a significantly different tone to trading. Over the past few weeks we have seen call options being offered in rallies and puts being bid during selloffs, which is not a bullish sign. This week however we saw calls being bid in the rally and puts being offered, which is a bullish sign for gold prices in our opinion.
On Tuesday when gold pushed above the $1700 mark for the first time in a month, trading in the options indicated to us that this was not simply a continuation of the consolidation phase, but could well be the start of a significant new rally higher. Call options and straddles were bought heavily that day and this combined with significantly higher futures volume has suggested to us that this move could have some weight behind it.
During Wednesday’s trading session it was more of the same. Gold prices increased and there were plenty of bids for call options, whilst the volatility was higher across the term structure (implied volatilities for gold options were almost 2% higher at the front end of the curve and 1% higher at the back end). Basically these indications lead us to believe that this rally may have some real juice in the tank.
Moving on to silver, our technical analysis suggests a significant move is underway. This analysis is based on the Bollinger Bands (BBs), which are bands plotting two standard deviations away from a simple moving average.
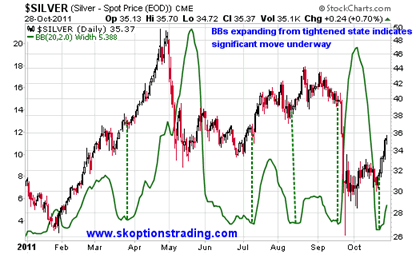
BBs tend to tighten on silver before a large move and although this signal is non-directional, it is still useful, especially for option traders. If one cannot gauge what direction silver is going to move, but knows that it is going to move significantly then profitable trades can still be placed using options where the trader is “long volatility”, without having a directional bias. However in this case it appears that this move will be to the upside. Whilst we do have a small position on silver, we are reluctant to risk too much in a market that has been smashed twice in one year by discretionary CME margin hikes. We will watch with interest however and be alert for future trading opportunities in this area.
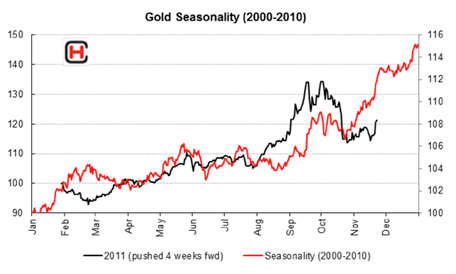
Seasonality has a large part to play in both metals. Usually after the summer doldrums we see strength building in gold during September through to as far as May. However this year gold appears to have got ahead of itself, with the rally beginning in late July and continuing strongly through August. The chart below (from Ben Davies and the team at Hinde Capital, www.hindecapital.com) illustrates this point. When the 2011 price action in gold is pushed forward four weeks, it becomes apparent that we could be in for a major rally over the next few months.
Looking towards the economic situation, we having seen an uptick in the economic picture (at least from the market’s perspective) and this is shown by the recent steepening of the US yield curve.
For those readers who may be unfamiliar with how the yield curve works, we will provide a brief explanation. Bonds of different maturities have different yields. By plotting these yields against their maturities we can build a yield curve. The yield curve becomes steeper if longer term interest rates increase relative to shorter term interest rates. The yield curve becomes flatter if longer term interest rates decrease relative to shorter term interest rates. One way to measure the steepness of the yield curve is to look at the difference between the yields at two different points on the curve. For example one may look at the difference between the yields on 2 year Treasuries compared to the yield on 5 year Treasuries. Such a comparison will often be referred to as “2s5s” and is measured in basis points (bps) by subtracting the shorter term yield from the longer term yield. So if one says “2s5s are trading at +225” this means that the yield on 5 year bonds is 2.25% higher than the yield on 2 year bonds. If 2s5s go from +225 to +275 then the yield curve has steepened between those two maturities. If 2s5s go from +225 to +175 then the yield curve has flattened between those two maturities.
For the majority of 2011, the loss in economic momentum caused the curve to flatten massively. A weaker economy means that interest rates will probably be held lower for longer, therefore longer term interest rates fall relative to shorter term interest rates, causing a flattening of the curve.
Recently however the curve has been steepening.
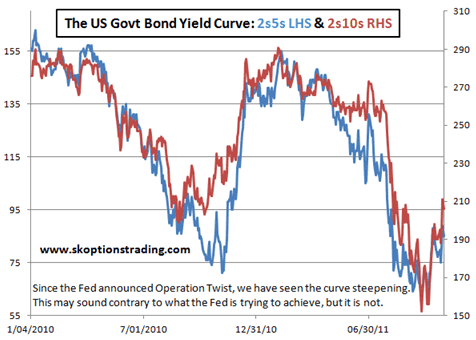
Some may question the yield curve steepening, just a month after the Fed announced Operation Twist, which involves the Fed selling shorter term treasuries and buying longer term treasuries. Although Operation Twist’s stated aim was to flatten the yield curve, this was only a means to an end, not the end in itself. The ultimate aim is to improve the economic situation. Therefore if the Fed policy is successful the curve should be steepening and longer term interest rates rising. This is what has happened since Operation Twist.
A similar scenario unfolded after QE2, although the Fed was buying bonds to keep interest rates low, interest rates began increasing as soon as the fed announced QE2. This is because the market perceived the economy to be improving and therefore sold treasuries in favour of more risky assets, sending yields higher.
We can see further results of this increase in confidence on other market sectors. A combination of Operation Twist and a “solution” to the current Eurozone problems have seen risk assets being bought across all markets.
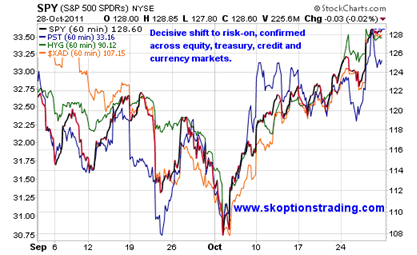
The following chart shows this decisive shift to risk-on in the last month; confirmed across equity (SPY – S&P 500 ETF), treasury (PST - ProShares UltraShort 7-10 Year Treasury ETF), credit (HYG - iShares iBoxx High Yield Corporate Bond Fund) and currency (Australian Dollar) markets.
So what is the aggregate effect of these market shifts on gold and silver?
In our opinion we are seeing the beginning of a new move higher in gold and silver. Global monetary policy is not going to be tightening any time soon and there is still room for significantly more easing in Europe and the US. Persistently high unemployment is piling pressure on the Fed to embark on further easing due to their dual mandate and Europe’s problems are well known. Whilst we may not see some action for a while from the Fed or ECB, since Operation Twist was just over a month ago and the EU has only just announced the plans for the expanded EFSF, it is likely that we will see easing in 2012. Now is the time to be taking long positions in gold since expectations of future easing will be increasing over coming months, leading to upwards pressure on the gold price.
We are trading this move with options as we feel they are the optimal tool for managing risk and reward dynamics in this environment. If you wish to add an options trading element to your trading strategy then a SK OptionTrader subscription is a good start. All our trades are based on US markets and since we trade options based on ETF’s, our trading recommendations can be executed as easily as buying or selling stock options. All subscribers receive our market updates, trading signals and our model portfolio. Each trade contains all necessary details such as exactly which options we are buying/selling, at what price and how much of our model portfolio we are risking in each trade. The risk in all our trading recommendations is strictly limited.
In conclusion our view is that there is bullish momentum building in the gold and silver markets. A strong floor in gold at $1600 and bullish long term fundamentals warrant a long bias that should be increased on dips. Silver should follow gold higher, however this market is more vulnerable to large corrections and so investors should tread with caution.
To stay updated on our market commentary, which gold stocks we are buying and why, please subscribe to The Gold Prices Newsletter, completely FREE of charge. Simply click here and enter your email address. (Winners of the GoldDrivers Stock Picking Competition 2007)
For those readers who are also interested in the silver bull market that is currently unfolding, you may want to subscribe to our Free Silver Prices Newsletter.
DISCLAIMER : Gold Prices makes no guarantee or warranty on the accuracy or completeness of the data provided on this site. Nothing contained herein is intended or shall be deemed to be investment advice, implied or otherwise. This website represents our views and nothing more than that. Always consult your registered advisor to assist you with your investments. We accept no liability for any loss arising from the use of the data contained on this website. We may or may not hold a position in these securities at any given time and reserve the right to buy and sell as we think fit. Bob Kirtley Archive |
© 2005-2022 http://www.MarketOracle.co.uk - The Market Oracle is a FREE Daily Financial Markets Analysis & Forecasting online publication.
Comments
|
normalaird
01 Nov 11, 02:48 |
gold price
Friday the spot price for gold closed at $1,743.40 per ounce. http://bit.ly/tbwxz8 |


