UK FTSE 100 Stock Market Index Triple Play Fibonacci Analysis
Stock-Markets / UK Stock Market Nov 09, 2011 - 04:23 AM GMT Price, time and sentiment represent a three dimensional approach to technical analysis of any market or security. The Fibonacci drill-down grid method is particularly instructive at the current price juncture in the UK FTSE 100. The key to this three-dimensional method is to identify the "hot" Level 1 grid, i.e. the high and low in a Fibonacci grid that produces an extended numbers of clear turns on Level 1 and Level 2 grid lines.
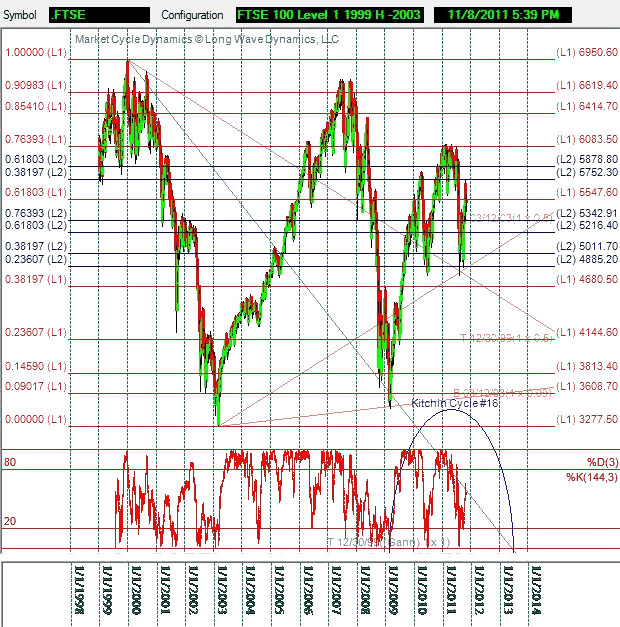
The most active Level 1 grid identified in the FTSE is the 1999 high at 6950.60 and the 2003 low at 3277.50. The drill-down grid method requires the intraday high and low for reasons not elaborated here. The Fibonacci drill-down grid uses compliment ratios, e.g. the high of 100% of the Level 1 move minus the 23.6% ratio produces the 76.4% ratio, which is not a Fibonacci ratio but represents the 23.6% Fibonacci ratio on the way to the grid high. This ratio stopped the FTSE cold at the highs earlier this year.

Fibonacci grids establish the phase boundaries in the fields of human action that guide markets. If you are not tracking these grids and related cycles, it is akin to watching a championship ball game without paying any attention to the score or the plays being run, even if the friends, beer and peanuts make the experience a pleasure.
The FTSE is currently battling the bull and bear forces on either side of the Level 1 golden ratio target at 5547.60 of the L1 grid. This is typically the most important target in any grid. How the FTSE resolves this struggle will be important for not only the future direction of the FTSE, but all major developed global markets.
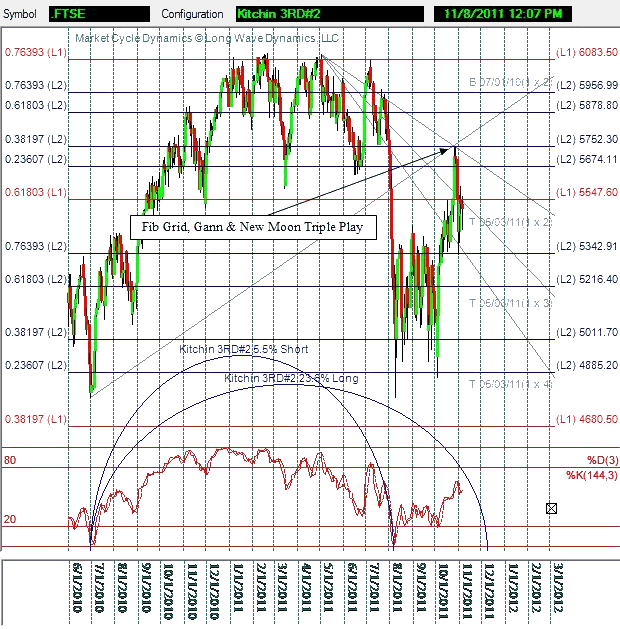
The intersection of Gann lines on a Fibonacci grid line is a new technical method for identifying a high probability turn in any market in price and time. Two intersecting fan lines, plus a grid line, raise the odds of a turn. The included charts demonstrate several important turns. The above chart presents Fibonacci fans intersecting the August lows on the 23.65 Level 2. The chart below illustrates the Gann fans intersecting at the high on 10/27/2011 at the Level 2 38.2% target, which was also a new moon, triggering a FTSE triple play of sorts.

The S&P 500 is currently fighting to stay over the 1228 target, which is the 76.4% target in the entire 1982-2007 Level 1 grid of the bull market. The current junctures in these key developed markets will determine whether there is another low in the developed world, before a more impressive rally on the frond end of Kitchin 3RD#3. Weakness in emerging markets raises the global risks even further.
Every Kitchin 3RD cycle consist of three Wall cycles. Each Wall cycle has an ideal length of 141.9 days. Like other cycles, they run short and long in Fibonacci ratios in time, in the much the same manner as price. While physicists ponder space-time and fields of matter, investors and traders are more interested in fields of human action in price-time that influence global markets.
The recent rally in the FTSE and other key global markets is showing signs of being a bull trap. This opens up the chance for a final hard global selloff to end Wall #6 and the Kitchin 3RD#2 cycle if the FTSE and the S&P 500 fail at these critical junctures in their respective Fibonacci grids. The Kitchin 3RDs tend to show up nicely in the 144 period daily stochastics, but the current rally may be a bull trap that falls short of the overbought status. The August low was a bit early for a Kitchin 3RD#2 cycle juiced with massive amounts of QE from the United States.
Either way, the larger cycles are on schedule to turn down and make important lows from late 2012 to mid-2013, in the current global business cycle and the global long wave. These lows will be far below current levels. Once the upcoming long wave low is out of the way, a major global bull market and new long wave spring will begin, if only the politicians will get out of the way.
David Knox Barker is a long wave analyst, technical market analyst, world-systems analyst and author of Jubilee on Wall Street; An Optimistic Look at the Global Financial Crash, Updated and Expanded Edition (2009). He is the founder of LongWaveDynamics.com, and the publisher and editor of The Long Wave Dynamics Letter and the LWD Weekly Update Blog. Barker has studied and researched the Kondratieff long wave “Jubilee” cycle for over 25 years. He is one of the world’s foremost experts on the economic long wave. Barker was also founder and CEO for ten years from 1997 to 2007 of a successful life sciences research and marketing services company, serving a majority of the top 20 global life science companies. Barker holds a bachelor’s degree in finance and a master’s degree in political science. He enjoys reading, running and discussing big ideas with family and friends.
© 2011 Copyright David Knox Barker - All Rights Reserved Disclaimer: The above is a matter of opinion provided for general information purposes only and is not intended as investment advice. Information and analysis above are derived from sources and utilising methods believed to be reliable, but we cannot accept responsibility for any losses you may incur as a result of this analysis. Individuals should consult with their personal financial advisors.
© 2005-2022 http://www.MarketOracle.co.uk - The Market Oracle is a FREE Daily Financial Markets Analysis & Forecasting online publication.


