


Stock Market, The Collapse of Wall Cycle #6
Stock-Markets / Cycles Analysis Nov 16, 2011 - 02:01 AM GMT

 The late market analyst PQ Wall put forward a rather bold proposal concerning the regular business cycle, which is also known as the Kitchin cycle. Wall concluded that every business cycle subdivides into three sets of three smaller cycles, for nine total cycles. Based on PQ's contribution to market cycle research, this cycle is known as the Wall cycle. The Wall cycle ideally runs about 142 days in length, just over 20-weeks, but they often run shorter and longer than this ideal length in Fibonacci ratios of their ideal length.
The Wall cycle is must track cycle for investors and traders, while for unsuspecting investors and traders it is a recurring nightmare. The Wall cycle regularly discounts market prices and provides regular buying and selling opportunities for value and growth investors.
The evidence is mounting that PQ Wall was correct and that every business cycle contains nine smaller cycles. This fact is particularly relevant at this time. PQ Wall taught that cycles 3, 6 and 9 in every business cycle are the weakest cycle at the end of every third of a business cycle.
The Wall cycle is a timely topic because major developed global markets are currently hitting Fibonacci price resistance at the top of Wall #6. From the March 2009, global market lows there have been five full Wall cycles. Global markets are now testing the top-end of Wall #6, and many appear to be rolling over. The collapse of Wall #6 may be one for the record books.
The global Wall cycle picture is mixed. Over-the-top fiscal and monetary intervention and artifical support of markets is distorting sentiment readings. However, the August lows have held in the NASDAQ 100, the UK FTSE 100, the Swiss SMI, the Australian ASX and a few other developed and emerging markets and sentiment has now reached overbought levels, indicating Wall #6 is ready to decline.
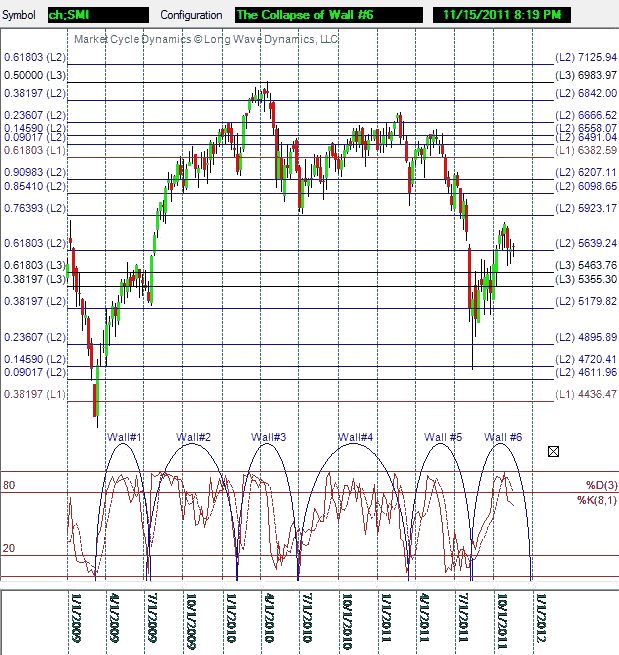
The chart below demonstrates the dynamic clockwork of the price, time and sentiment in the six Wall cycles in Switzerland's SMI since the March 2009 lows. The 20-to-80-to-20 runs in the stochastics are the 8-period weekly fast. The chart also demonstrates that the SMI is now attempting to stay above the golden ratio Level 2 Fibonacci grid target at 5639. The Level 1 grid comes from the most important Level 1 high and low that demonstrates Fibonacci turns. When important Level 1 and Level 2 Fibonacci support targets give way in any market, it often marks the turn of a Wall cycle at a top or bottom. A break below the Level 2 golden in the SMI is expected to accelerate the decline of Wall #6, with other major markets at critical Fibonacci support and resistance levels.
Market analysis that seeks to uncover the cycles driving global markets is a tough job when governments and central bankers spending other people's money (OPM) fire trillions in U.S. dollar and euro bazookas randomly into markets. The deployment of large sums of capital without the conviction and discretion of the true self-interested earner and owner of the capital distorts markets, attempting to shift risks into the future. It can accelerate declines when they finally come.
Intervention is clearly distorting the cycles, but the primary cycle count remains that global developed markets are topping in Wall Cycle #6. Global markets now face a third, last and weakest Wall cycle decline. Despite the call of the bulls and some of the tempting evidence in their favor, such as the power of the large cap franchise companies to deliver profits, the path of least cycle resistance is down.
The S&P 500 chart presented below demonstrates that Wall #3 was far weaker than the other cycles into the July 1, 2010 low and the golden ratio Fibonacci supporting floor. The stochastics are 55-period daily fast. The market declines into October in many developed markets are candidates for a third, last and weakest Wall #6. However, the weight of the global cycle evidence and the acceleration of the debt crisis in Europe and in the U.S., indicates Wall cycle #6 remains in force, with the greatest declines straight ahead.
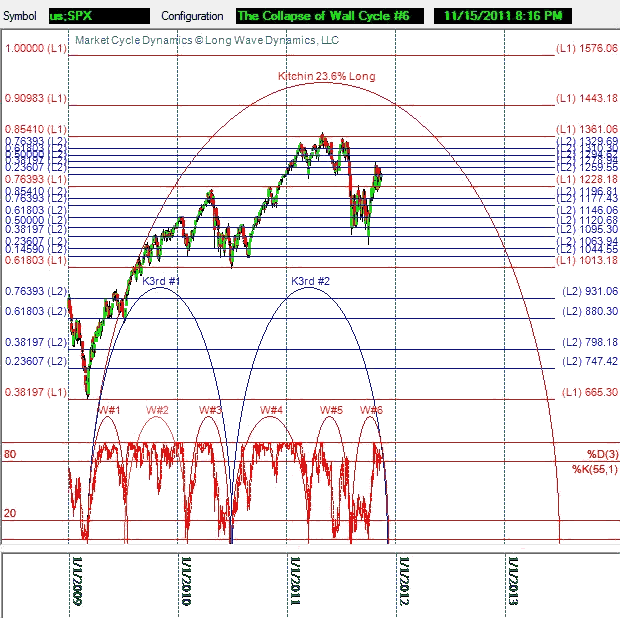
The rally from the October lows appears to be an elaborate bull trap set by Wall Cycle #6. If the current Level 2 Fibonacci 76.4% supporting target of S&P 500 1228 does not hold, the decline could take on a life of its own. The S&P 500 summer 2010 lows at 1013 in the S&P 500 may require a test. It is possible they will fail. In short, get prepared for the collapse of Wall #6. It has the potential to shake global financial markets to their foundations.
David Knox Barker is a long wave analyst, technical market analyst, world-systems analyst and author of Jubilee on Wall Street; An Optimistic Look at the Global Financial Crash, Updated and Expanded Edition (2009). He is the founder of LongWaveDynamics.com, and the publisher and editor of The Long Wave Dynamics Letter and the LWD Weekly Update Blog. Barker has studied and researched the Kondratieff long wave “Jubilee” cycle for over 25 years. He is one of the world’s foremost experts on the economic long wave. Barker was also founder and CEO for ten years from 1997 to 2007 of a successful life sciences research and marketing services company, serving a majority of the top 20 global life science companies. Barker holds a bachelor’s degree in finance and a master’s degree in political science. He enjoys reading, running and discussing big ideas with family and friends.
© 2011 Copyright David Knox Barker - All Rights Reserved Disclaimer: The above is a matter of opinion provided for general information purposes only and is not intended as investment advice. Information and analysis above are derived from sources and utilising methods believed to be reliable, but we cannot accept responsibility for any losses you may incur as a result of this analysis. Individuals should consult with their personal financial advisors.
© 2005-2022 http://www.MarketOracle.co.uk - The Market Oracle is a FREE Daily Financial Markets Analysis & Forecasting online publication.