


New Stock Market Action is Right Around the Corner
Stock-Markets / Stock Markets 2011 Nov 16, 2011 - 03:50 PM GMTBy: Marty_Chenard

 If we were to get a Santa Claus rally ... How high could it go?
The answer can be found on today's chart as seen below ...
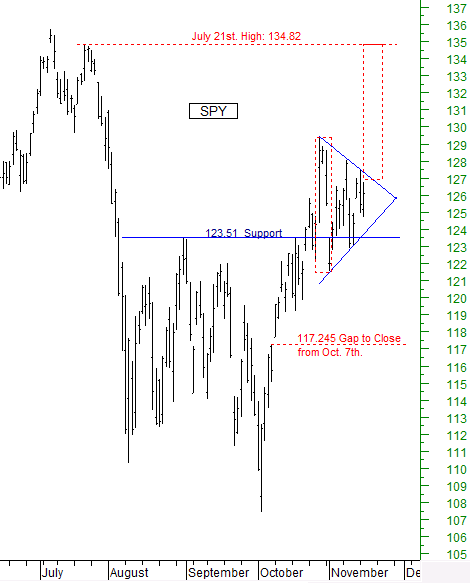
First, notice that the SPY has a symmetrical triangular pattern that is very close to its apex (the convergence of its support and resistance lines). Being close to the apex means that it will have its breakout very soon.
Let's face it, there are only two possibilities here ... it either breaks out to the upside, or to the downside.
If it happened today, it would likely be to the upside because there is still a small positive bias to the upside. After the next 24 to 48 hours, that could change because the positive bias has been diminishing.
What would it look like if the breakout is to the upside?
Given that we have a symmetrical triangle, the projection would be to slightly above 134 ... and guess what? That happens to be the intra-day high, resistance level, coming from July 21st.
What would it look like if the breakout is to the downside?
If you look closely at the chart, there is an unfilled gap at 117.245 from an intra-day high that occurred on October 7th. If a downside breakout is the one that occurs and holds below 123.51, then the likelihood is that the 117.245 gap would get closed with an outside possibility of moving lower to 117.34 which would be the pattern's downside projection.
So, keep your eyes open because some market action is right around the corner.
By Marty Chenard
http://www.stocktiming.com/
Please Note: We do not issue Buy or Sell timing recommendations on these Free daily update pages . I hope you understand, that in fairness, our Buy/Sell recommendations and advanced market Models are only available to our paid subscribers on a password required basis. Membership information
Marty Chenard is the Author and Teacher of two Seminar Courses on "Advanced Technical Analysis Investing", Mr. Chenard has been investing for over 30 years. In 2001 when the NASDAQ dropped 24.5%, his personal investment performance for the year was a gain of 57.428%. He is an Advanced Stock Market Technical Analyst that has developed his own proprietary analytical tools. As a result, he was out of the market two weeks before the 1987 Crash in the most recent Bear Market he faxed his Members in March 2000 telling them all to SELL. He is an advanced technical analyst and not an investment advisor, nor a securities broker.
Marty Chenard Archive |
© 2005-2022 http://www.MarketOracle.co.uk - The Market Oracle is a FREE Daily Financial Markets Analysis & Forecasting online publication.