


Gold Turns Bearish Short-term
Commodities / Gold and Silver 2011 Nov 20, 2011 - 10:00 AM GMTBy: Merv_Burak

 Take away Thursday’s drop and we have a week that did nothing for gold. However, we cannot take Thursday away so it was a negative week. It looks like more to come, from a technical point of view.
GOLD
LONG TERM
It looks like gold may be heading back to test that long term moving average line but in the mean time there seems to be little change in the long term position as of the Friday close.
Trend: Gold remains above its positive sloping long term moving average line. Whether you draw a simple or semi-log scale long term chart for gold you see some well defined long term trend lines. Gold remains well above both long term up trend support lines. It is reacting downward after just touching its resistance long term trend lines on both charts. So, from this, one can assume that the down side is the direction for a while but that the price can still drop a reasonable amount without affecting the long term up trend.
Strength: Looking at the long term momentum indicator on a daily chart we see that the momentum turned to the up side in Nov of 2008, crossed into its positive zone in early Jan of 2009 and has remained in its positive zone ever since. Although still in its positive zone the long term momentum indicator has not been showing any great strength behind the recent rally and has once more dropped below its now negative sloping trigger line.
Volume: The volume indicator did not really pick up steam until the middle of 2009. Since then its trigger line has remained in a positive slope until very recently. Although the indicator had dropped slightly below its trigger line a few times along the way the trigger remained positive until very recently. The indicator is now below its long term trigger line and the trigger line is now also in a negative slope.
As of the Friday close the long term rating remains BULLISH although the direction of the various indicators would suggest that we might be in for some downgrade shortly.
INTERMEDIATE TERM
The intermediate term is a little bit on the mixed side as far as the indicators are concerned. Something’s gotta give.
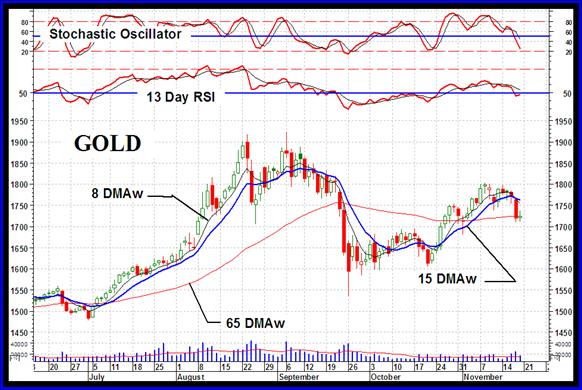
Trend: Gold is toying with its intermediate term moving average line and although much of the Friday trading was below the line it did end the day just a hair above the line. Unfortunately, the line itself is in a very slight negative slope.
Strength: The intermediate term momentum indicator is heading towards its neutral line but did finish the week slightly above the line. It is already below its trigger line and the trigger is sloping downward.
Volume: Although in a still lateral trend the volume indicator is showing signs of heading lower. It is below its trigger line and the trigger has turned to the down side.
All in all the intermediate term rating at the Friday close is not quite a full bull but is at a + NEUTRAL level, one level below the full bull. The short term moving average line has turned downward but remains above the intermediate term line for confirmation of a positive rating although not necessarily a full bull.
SHORT TERM
From a short term perspective things are getting worse and worse. Weakness has been entering the picture over the past few weeks but this week it was most evident.
Trend: The short term up trend has been busted and the down trend is in vogue. Gold has dropped below its short term moving average line and the line is heading downward.
Strength: The short term momentum indicator has entered its negative zone and remains below its negative trigger line.
Volume: The daily volume action remains low, as can be expected if the trend is towards lower levels. The fact that the daily volume has not increased significantly during the down moves suggests, at this point in time, that the down trend my not last very long. Should the daily volume increase as the trend moves lower, that would not be a good sign.
The short term rating at the Friday close is BEARISH. This is confirmed by the very short term moving average line having now crossed below the short term line.
As for the immediate direction of least resistance, I would be inclined to go with the down side at least for another day or two. That would put the Stochastic Oscillator into the oversold zone creating the potential for a rebound.
SILVER
LONG TERM
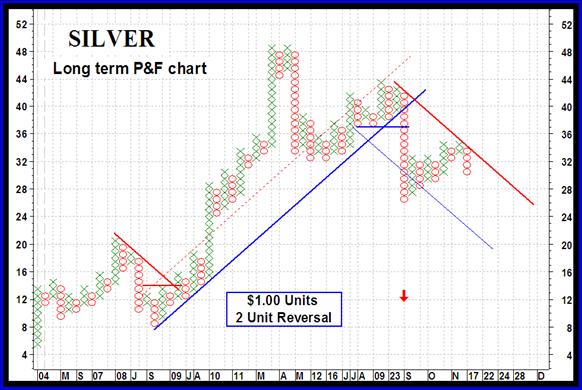
The long term P&F chart for silver has been pretty good for us. The recent rally stopped right at its down trend line and the price is now reacting. The initial projection on the break was to the $28 level, which it reached quite quickly. Now, the next projection is all the way back to the $12 level. We’ll just have to see if THAT ONE comes true. I wouldn’t place any money on it but I would not ignore it either.
Trend: Silver continues to trade below its long term moving average line and the line slope remains to the down side.
Strength: The long term momentum indicator continues to hug its neutral line and basically move in a lateral direction. At the Friday close it ended below the line and below its negative sloping trigger line.
Volume: The volume indicator is not doing much but did end the week just slightly above its positive trigger line.
For the long term the rating, at the Friday close, is BEARISH.
INTERMEDIATE TERM
Trend: For the past few weeks silver has been moving above and below its intermediate term moving average line although the line had consistently remained in a negative slope. On the Friday close silver ended below its moving average line and the line remained sloping downward.
Strength: The intermediate term momentum indicator continues to show weakness in the price move. It remains below its neutral line and below its negative sloping trigger line. The only minor encouragement in the momentum indicator is its up trend line. From its mid-Sept low we can draw an up trend line in the momentum indicator. At the Friday close the indicator remains just above this line (although in the negative zone). The price has already crossed below its similar up trend line but this may be a false break as the momentum is usually the more accurate line to follow (when we have one).
Volume: The volume indicator moved below its trigger line during the week and bounce upwards on Friday to just about crossing above the line. Not quite but almost. The trigger remains in a very slight upward slope.
On the intermediate term, at the Friday close, the rating is BEARISH. This bear is confirmed by the short term moving average line having just crossed below the intermediate term line.
SHORT TERM
Trend: The Thursday action was significant and put silver decidedly below its negative sloping moving average line, where it remains after the Friday close.
Strength: Although weak the short term momentum had remained in its positive zone until the Thursday action. It is now in its negative zone and below its negative trigger line.
Volume: The daily volume action remains low and not a significant factor technically.
At the Friday close the short term rating is BEARISH. This bear is confirmed by the very short term moving average line having moved below the short term line.
As for the immediate direction of least resistance, I’ll go with the down side here along with gold. Despite Friday’s up day all the indicators suggest weakness and the Stochastic Oscillator is not yet in its oversold zone. Another day or two should do it.
Merv’s Non-Edibles Futures Indices Table
For weekly information and commentary on gold and silver stock Indices and Merv’s 190 gold and silver stocks please go to the subscribers section at http://preciousmetalscentral.com.
Well, that’s it for this week. Comments are always welcome and should be addressed to mervburak@gmail.com.
By Merv Burak, CMT
Hudson Aero/Systems Inc.
Technical Information Group
for Merv's Precious Metals Central
For DAILY Uranium stock commentary and WEEKLY Uranium market update check out my new Technically Uranium with Merv blog at http://techuranium.blogspot.com .
During the day Merv practices his engineering profession as a Consulting Aerospace Engineer. Once the sun goes down and night descends upon the earth Merv dons his other hat as a Chartered Market Technician ( CMT ) and tries to decipher what's going on in the securities markets. As an underground surveyor in the gold mines of Canada 's Northwest Territories in his youth, Merv has a soft spot for the gold industry and has developed several Gold Indices reflecting different aspects of the industry. As a basically lazy individual Merv's driving focus is to KEEP IT SIMPLE .
To find out more about Merv's various Gold Indices and component stocks, please visit http://preciousmetalscentral.com . There you will find samples of the Indices and their component stocks plus other publications of interest to gold investors.
Before you invest, Always check your market timing with a Qualified Professional Market Technician
Merv Burak Archive |
© 2005-2022 http://www.MarketOracle.co.uk - The Market Oracle is a FREE Daily Financial Markets Analysis & Forecasting online publication.