


Silver Price at Good Entry Point for Major Up-trend
Commodities / Gold and Silver 2011 Dec 05, 2011 - 08:43 AM GMTBy: Clive_Maund

 With Europe teetering on the verge of collapse, the world has been teetering on the verge of a deflationary implosion, and it still is. That is the reason for the recent severe downdraft in the markets. What is believed to be happening now is that the global banking elites, who ARE the de facto government in many countries, like the US, are scrambling to prevent the collapse of their European division. The stakes are immense - if they succeed they "will kick the can down the road" and push all or much of the banks' bad debts off onto the electorate and taxpayers via austerity measures, bailouts and tax hikes and the course will be set for a hyperinflationary depression, if they fail then we will see the more immediately dramatic and much feared deflationary implosion.
As we will see Smart Money appears to be betting on the banks succeeding in their objectives. Why shouldn't they? - as noted above they are the de facto world government and thus their will should prevail. If Germany and Mrs Merkel, fearing hyperinflation, try to stand in their way, force will be brought to bear - a few more failed bond auctions ought to do the trick. With regards to the banks' power it is interesting to note that Goldman Sachs has more power in the US than the entire US electorate, until the latter become mobilized that is.
The sudden realization that the global banks are about to come riding to Europe's rescue is what caused the strong rally across world markets last week, and although the markets look set to take a breather, it looks likely that they will continue higher as the bailout process gains traction. Other aspects of this fundamental situation that are equally applicable to silver are discussed at some length in the parallel Gold Market update and we will now turn to examining the latest silver charts.
Superficially silver still looks pretty sick on the charts and weak compared to gold. However, the more closely you look at it, the more bullish the picture becomes. In the last update we had identified a potential Head-and-Shoulders top in silver on its 18-month chart, which would - and still could - become operative if Europe founders and the deflationary scenario prevails. However, the events of last week are evidence that a rescue is in its early stages, and that large scale money creation is on the way in order to faciliate this. This being so the potential H&S top looks set to abort, and there are some important indications that Smart Money has positioned itself for this.
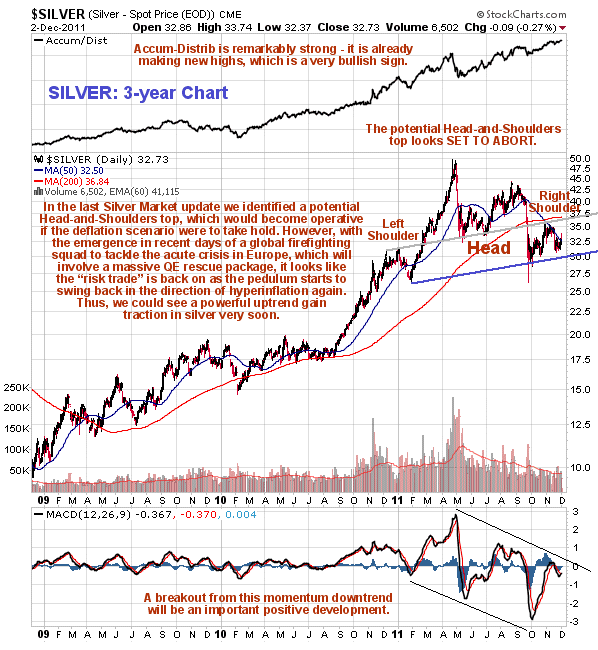
On the 3-year chart for silver we can see the potential Head-and-Shoulders top, but we can also see that volume indicators are strong, relative to price, particularly the Accum-Distrib line which rather incredibly has been making new highs just over the past week or two, which is strongly bullish indication. A breakout from the momentum downtrend shown by the MACD indicator will be a sign that a major new uptend is getting started. The position of the silver price relative to its 200-day moving average gives us insight regarding its upside potential from here - it has gone from being way above its 200-day moving average late in April to being some way below this average now - so clearly there is room for a big move up from here.
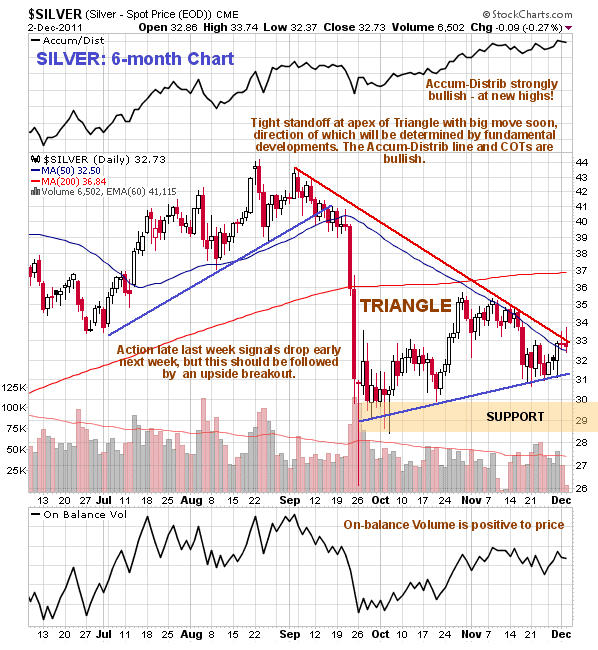
On its 6-month chart we can see that the silver price is currently being contained within the boundaries of an irregular triangular pattern that parallels the more symmetrical one that has formed in gold during the same period. Contact with the upper Triangle boundary and the falling 50-day moving average in November resulted in the price being forced lower again, and also resulted in a failed breakout attempt from the Triangle on Thursday and Friday of last week. However, the Triangle is now rapidly closing up so a breakout MUST occur soon, and while the rather bearish action late last week does suggest a short-term minor reaction, a decisive upside breakout is expected to occur soon, even if it is preceded by a false downside break. In addition to the positive volume indicators, especially the Accum-Distrib line, another factor pointing to the probability of an upside breakout is the fact that the price and 50-day moving average are now quite some way below the still rising 200-day moving average, which was not the case early in November when the price got turned back down.
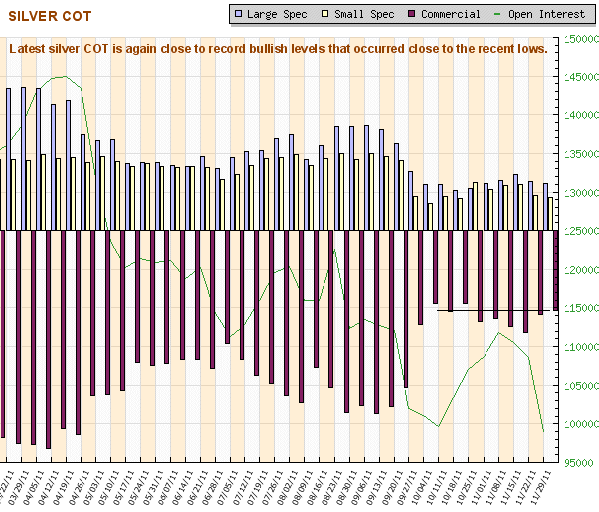
With Commercial short positions and Large and Small Spec long positions having dropped back towards their recent extremely low levels over the past couple of weeks, the COT structure certainly looks highly favorable for a major uptrend to get underway soon. When these extremely low levels persist for weeks but the price doesn't advance it is easy to get skeptical about their implications, we have ourselves. We should not allow ourselves to fall into this trap - by the standards of recent years these readings are very bullish indeed.
Conclusion: we are believed to be at a very good entry point for silver and silver related investments here, especially if we see a short-term dip, as a major uptrend is expected to get underway soon.
By Clive Maund
CliveMaund.com
For billing & subscription questions: subscriptions@clivemaund.com
© 2011 Clive Maund - The above represents the opinion and analysis of Mr. Maund, based on data available to him, at the time of writing. Mr. Maunds opinions are his own, and are not a recommendation or an offer to buy or sell securities. No responsibility can be accepted for losses that may result as a consequence of trading on the basis of this analysis.
Mr. Maund is an independent analyst who receives no compensation of any kind from any groups, individuals or corporations mentioned in his reports. As trading and investing in any financial markets may involve serious risk of loss, Mr. Maund recommends that you consult with a qualified investment advisor, one licensed by appropriate regulatory agencies in your legal jurisdiction and do your own due diligence and research when making any kind of a transaction with financial ramifications.
Clive Maund Archive |
© 2005-2022 http://www.MarketOracle.co.uk - The Market Oracle is a FREE Daily Financial Markets Analysis & Forecasting online publication.